








strong historical levels
Info
The strong historical levels is a Indicator for MetaTrader 5 that historical levelsare prices over life time of a symbol which technically believed as most repeated prices. from financial point of view, these prices are important limits of economical conditions of a financial environment which is shadowed over dedicated symbol chart.
Usage
This tool is typically used for enhancing chart analysis and decision making.
Platform
This Indicator works exclusively on MetaTrader 5 (both build 600+ and newer versions).
Setup
Place the downloaded file in MQL5/Indicators folder via File ? Open Data Folder in MetaTrader 5.
How to Install and Use strong historical levels
1. Installation: Place your file in the MQL/Indicators folder via "Open Data Folder" and restart your terminal.
2. Loading: Find the indicator in the Navigator, drag it onto your chart, and configure the input parameters in the popup window.
3. Customization: Press Ctrl+I to open the indicator list, select your tool, and click "Properties" to change colors, levels, or visual styles.
4. Updating: Replace the old file in the Indicators folder with the new version and restart the platform to apply changes.
Frequently Asked Questions
Q: Why is my indicator not showing? A: Verify the file is in the MQL/Indicators folder, or try right-clicking the "Indicators" tree in the Navigator and clicking "Refresh."
Q: Do custom indicators slow down the platform? A: Too many complex indicators can impact performance; remove unused ones via the "Indicator List" (Ctrl+I).
Q: Can I use MT4 indicators on MT5? A: No, MQL4 and MQL5 are distinct languages; ensure the indicator is compiled specifically for your platform version.
What this tool does
historical levelsare prices over life time of a symbol which technically believed as most repeated prices.
Typical Use Case
This Indicator excels in automated trading and technical analysis on MetaTrader 5.
Compatible Platform & Setup
This Indicator works on MetaTrader 5. Place the file in the MQL5/Indicators folder and restart the terminal.
Description & Settings
Related: Double Envelopes Historical Gauged - another powerful indicator for MetaTrader 5 traders.
historical levels
are prices over life time of a symbol which technically believed as most repeated prices. from financial point of view, these prices are important limits of economical conditions of a financial environment which is shadowed over dedicated symbol chart. there are scientific materials shows these levels has linkage to financial limits/phases which price/rate can not easily pass those levels unless financial phase changes for considered symbol. these are strong reasons that a trader has to empower their market analyses with historical levels.
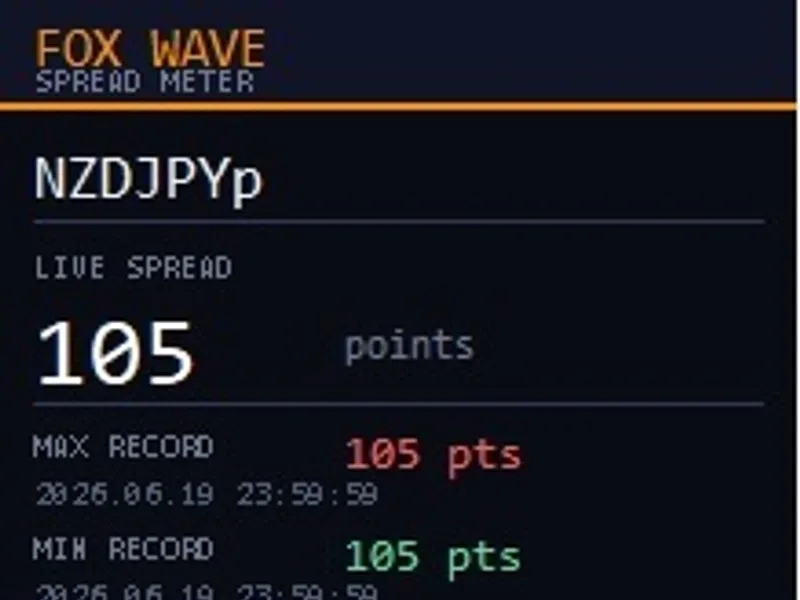
Also recommended: Spread Meter - Real-Time Spread Tracker with Historical Max/Min Records - similar indicator with strong performance on MetaTrader 5.
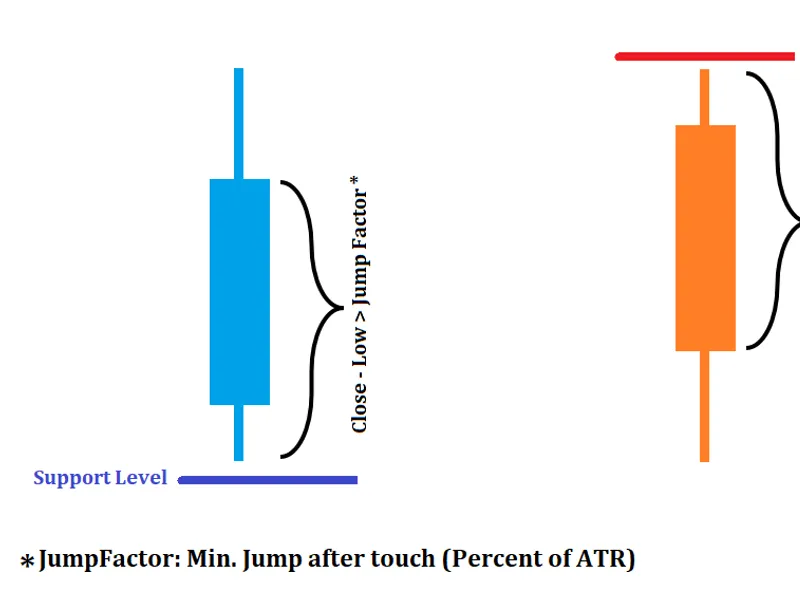
i tried to create a structural view on these levels from candle formation analyses point of view. price/rate behavior over these levels most probably has strong effect on candle shape. as an example, if there is a strong level for a price, we should have a price jump because of high amount of money sleeping on that price/rate or its around.considering this concept, two rules are developed:
rule 1
(bull candle on sup. level): if close - low > jump factor
rule 2
(bull candle on res. level): if close - low > jump factor & (close-low)/(high-low)>ratio
to make rules more clear two images are prepared.
image1: jumping from s/r levels with same action (like bull candle on support)
image 2: jumping from s/r levels but in reverse (like bull candle under resistance)
based on these rules (rules are selectable) an indicator developed which gathers data in two different matrix (sup_mat and res_mat). number of s/r levels obeying selected rules are shown on screen during gathering data. hense,
()
library used to make a clustering process over gathered data through
k-means method
. results illustrated as columns of support and resistance levels data.
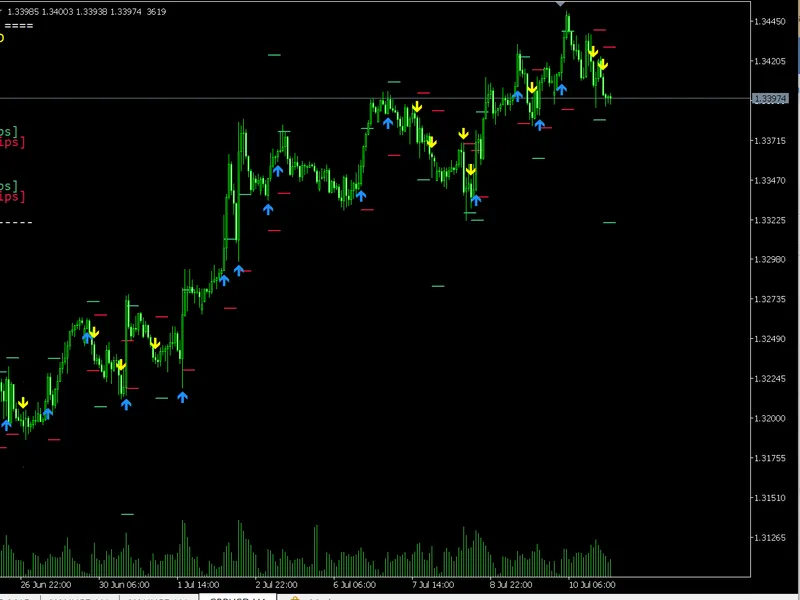
after enhancing levels, its open a chart with same symbol analysed and then draws all levels(clusters) over that chart according clustering process. some parameters of indicator can be changed from screen to make it more user-friendly. here is a brief illustration od screen graphics of tool and its results.
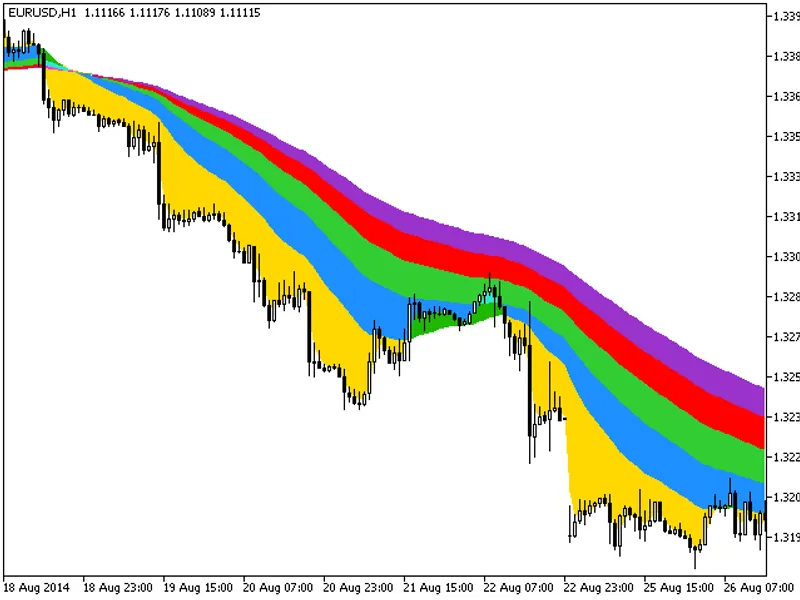
image 3: indicator screen
image 4: auto drawing of results of levels on chart
as conclusion, tool is very powerful even if we have to very basic rules and levels are showing strong support and resistance behavior. adding more rules is possible and code is in an easy mode to make more rules to enhance it. adding to extra rules, dividing clustering areas and make more dedicated clustering for those areas, searching for max distance taken before retouching levels can be further improvements for tool. anyone who like to have more, please contact me.
You may also like: Parkinson Historical Volatility Indicator - excellent alternative for indicator users on MetaTrader 5.
Source Code
#property copyright "RobotFX"
#property link "https://robotfx.org"
#property version   "1.00"
#property indicator_chart_window
#property indicator_buffers 0
#property indicator_plots 0
#property version   "1.00"
#property description "Educational code - RobotFX www.robotfx.org"
#property description "Educational code - RobotFX www.robotfx.org"
#include <..\include\Math\Alglib\dataanalysis.mqh>
.......
⚠ Limitations & Risk Warning
- This tool is provided for educational and testing purposes only.
- Past performance does not guarantee future results.
- Trading involves substantial risk of loss. Use on a demo account first.
- Results may vary depending on market conditions, broker, and settings.
- We recommend thorough backtesting and forward testing before using with real funds.