

Double Envelopes Historical Gauged
Info
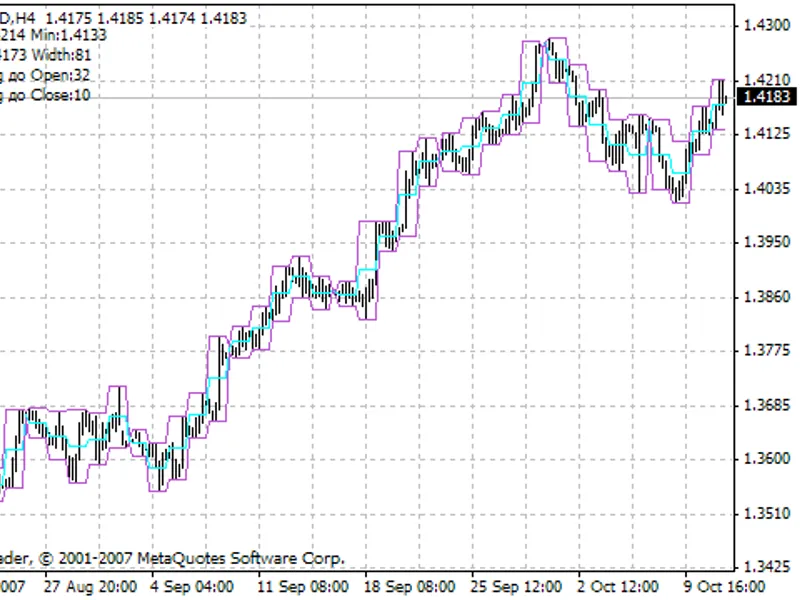
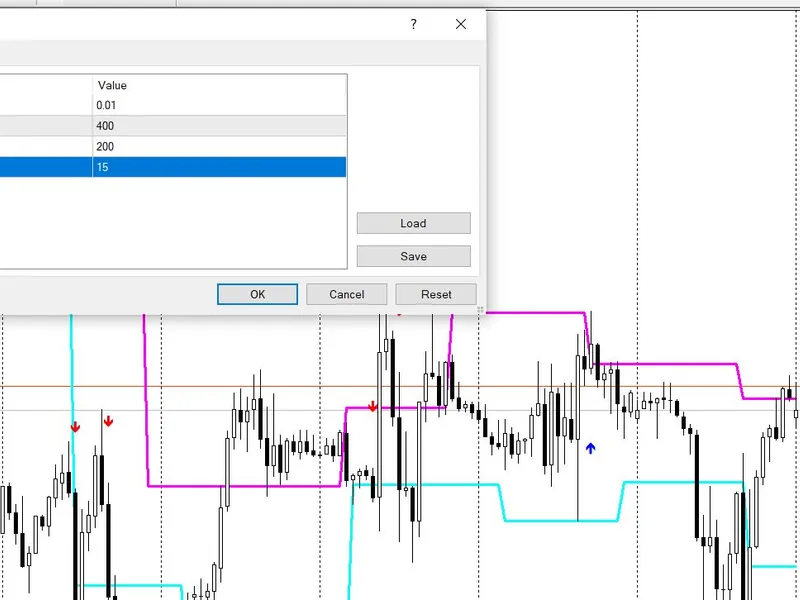
The Double Envelopes Historical Gauged is a Indicator for MetaTrader 5 that at its core, this indicator executes a volatility breakout strategy. By decoupling the two envelopes, it creates a tiered volatility map around the baseline moving average, hunting for moments when price violently escapes its normal resting range.
Usage
This tool is typically used for enhancing chart analysis and decision making.
Platform
This Indicator works exclusively on MetaTrader 5 (both build 600+ and newer versions).
Setup
Place the downloaded file in MQL5/Indicators folder via File ? Open Data Folder in MetaTrader 5.
How to Install and Use Double Envelopes Historical Gauged
1. Installation: Place your file in the MQL/Indicators folder via "Open Data Folder" and restart your terminal.
2. Loading: Find the indicator in the Navigator, drag it onto your chart, and configure the input parameters in the popup window.
3. Customization: Press Ctrl+I to open the indicator list, select your tool, and click "Properties" to change colors, levels, or visual styles.
4. Updating: Replace the old file in the Indicators folder with the new version and restart the platform to apply changes.
Frequently Asked Questions
Q: Why is my indicator not showing? A: Verify the file is in the MQL/Indicators folder, or try right-clicking the "Indicators" tree in the Navigator and clicking "Refresh."
Q: Do custom indicators slow down the platform? A: Too many complex indicators can impact performance; remove unused ones via the "Indicator List" (Ctrl+I).
Q: Can I use MT4 indicators on MT5? A: No, MQL4 and MQL5 are distinct languages; ensure the indicator is compiled specifically for your platform version.
What this tool does
At its core, this indicator executes a Volatility Breakout Strategy.
Typical Use Case
This Indicator excels in automated trading and technical analysis on MetaTrader 5.
Compatible Platform & Setup
This Indicator works on MetaTrader 5. Place the file in the MQL5/Indicators folder and restart the terminal.
Description & Settings
Related: double exponential moving average (dema) - another powerful indicator for MetaTrader 5 traders.
At its core, this indicator executes a Volatility Breakout Strategy. By decoupling the two envelopes, it creates a tiered volatility map around the baseline moving average, hunting for moments when price violently escapes its normal resting range.Also recommended: envelopes technical indicator - similar indicator with strong performance on MetaTrader 5.
Here is exactly how to interpret the logic for traditional trading decisions:
- The Entry (Momentum Ignition)
The inner envelope acts as your noise filter. In a quiet market, the price will ping-pong aimlessly inside this channel.
Buy Trigger: You enter a long position when a candle closes above the upper band of the inner envelope, provided the previous candle closed inside or below it. This clean cross signals that upward momentum has suddenly overpowered the baseline average.
Sell Trigger: You enter a short position when the candle closes below the lower band of the inner envelope, signaling a sudden downside momentum break.
- The Exit (Taking Profit)
The outer envelope acts as your dynamic profit target.
Because volatility expands outward during a breakout, the 2nd Envelope's higher deviation provides a realistic, mathematically derived target for where the sudden momentum spike is likely to exhaust itself. You exit the trade the moment price tags this outer band.
- The Risk Management (Stop Loss)
The Stop Loss is pegged to the opposite band of the inner envelope from the previous candle. This is a dynamic, structural stop. It places your risk just outside the normal noise range. If the price falls back through the entire inner envelope and hits the opposite side, the breakout has definitively failed into a fake-out.
The Ideal Market Environment
This setup thrives in high-liquidity, high-volatility environments where momentum actually follows through. It generally performs exceptionally well on assets prone to heavy institutional trends, like GBPUSD or XAUUSD, particularly during the London or New York trading overlaps.
Conversely, the kryptonite of this system is a low-volume, ranging market. If an asset is chopping sideways, the price will repeatedly poke outside the inner envelope just enough to trigger a signal, only to immediately reverse and hit your stop loss.
You may also like: Double Smoothed Stochastics (DSS) Bressert Indicator - excellent alternative for indicator users on MetaTrader 5.
Source Code
#property copyright "RobotFX"
#property version   "2.60"
#property indicator_chart_window
#property indicator_buffers 2
#property indicator_plots   2
input int                InpEnv1Period  = 14;
input ENUM_MA_METHOD     InpEnv1Method  = MODE_SMA;
input ENUM_APPLIED_PRICE InpEnv1Price   = PRICE_CLOSE;
input double             InpEnv1Dev     = 0.1;
input int                InpEnv2Period  = 21;
.......
⚠ Limitations & Risk Warning
- This tool is provided for educational and testing purposes only.
- Past performance does not guarantee future results.
- Trading involves substantial risk of loss. Use on a demo account first.
- Results may vary depending on market conditions, broker, and settings.
- We recommend thorough backtesting and forward testing before using with real funds.