Stripped T3 levels
This software component for MetaTrader 5 is built to enhance the capabilities of your trading environment. This technical indicator acts as a specialized analysis tool designed to visualize market data. It helps traders identify emerging trends, momentum shifts, and key support or resistance levels by plotting statistical calculations directly onto price charts.
How to Setup and Use Stripped T3 levels
1. Installation: Place your file in the MQL/Indicators folder via "Open Data Folder" and restart your terminal.
2. Loading: Find the indicator in the Navigator, drag it onto your chart, and configure the input parameters in the popup window.
3. Customization: Press Ctrl+I to open the indicator list, select your tool, and click "Properties" to change colors, levels, or visual styles.
4. Updating: Replace the old file in the Indicators folder with the new version and restart the platform to apply changes.
Frequently Asked Questions
Q: Why is my indicator not showing? A: Verify the file is in the MQL/Indicators folder, or try right-clicking the "Indicators" tree in the Navigator and clicking "Refresh."
Q: Do custom indicators slow down the platform? A: Too many complex indicators can impact performance; remove unused ones via the "Indicator List" (Ctrl+I).
Q: Can I use MT4 indicators on MT5? A: No, MQL4 and MQL5 are distinct languages; ensure the indicator is compiled specifically for your platform version.
Description & Settings
Theory:
Tim Tillson (that invented T3 indicator) used generalized DEMA in the T3 calculation. It is less known that there are 3 "levels" of that T3 calculation : GDEMA (as the first "level"), GDEMA of GDEMA (as the second "level") and GDEMA of GDEMA of GDEMA (which is the T3).
This indicator:
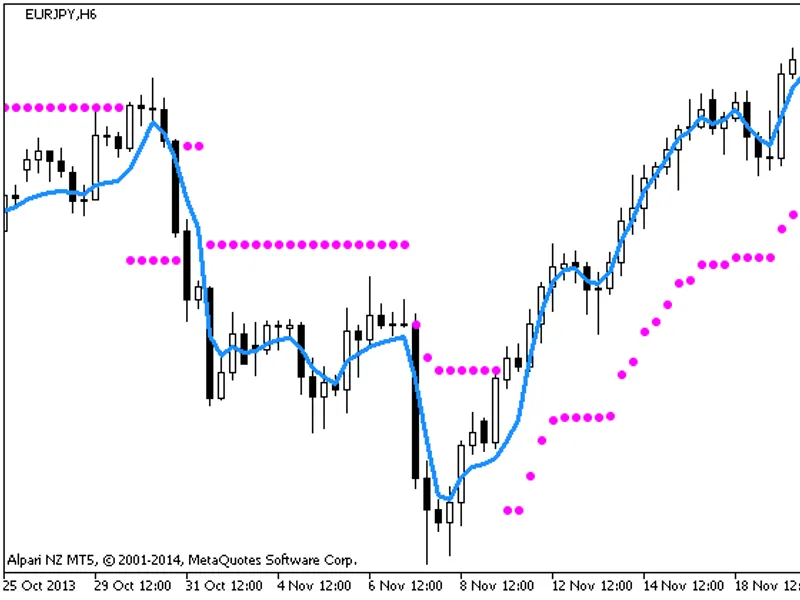
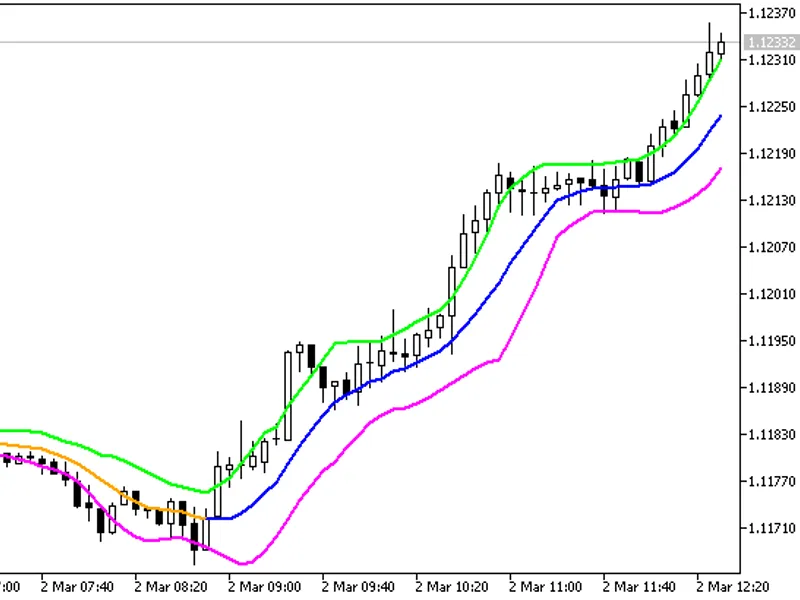
In it you can chose which "level" of the 3 you wish to be displayed. It is a sort of 3-in-1 indicator (since it is displaying the above described "levels"). It is also using self adjusting levels in order to identify trends. Instead of using slope of the calculated value, crosses of levels are used as trend direction, and that way they are filtering out the less significant slope changes that could lead to false signals.
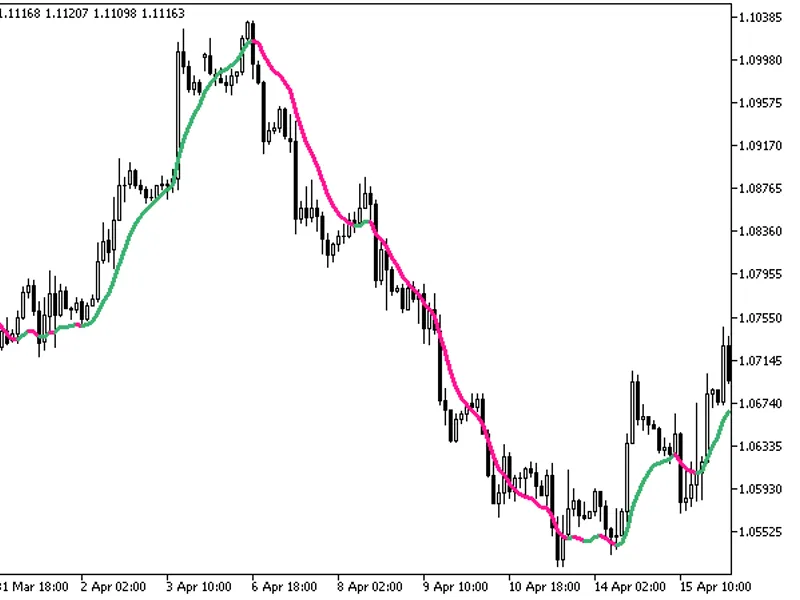
Usage:
You can use the color changes of the values as signals.
PS: the "big picture" example where all 3 "levels" are displayed (just the type is different, the rest of the parameters is the same).