Size Highs And Lows
This professional-grade solution for MetaTrader 5 helps traders achieve greater efficiency in their daily workflow. This technical indicator acts as a specialized analysis tool designed to visualize market data. It helps traders identify emerging trends, momentum shifts, and key support or resistance levels by plotting statistical calculations directly onto price charts.
How to Setup and Use Size Highs And Lows
1. Installation: Place your file in the MQL/Indicators folder via "Open Data Folder" and restart your terminal.
2. Loading: Find the indicator in the Navigator, drag it onto your chart, and configure the input parameters in the popup window.
3. Customization: Press Ctrl+I to open the indicator list, select your tool, and click "Properties" to change colors, levels, or visual styles.
4. Updating: Replace the old file in the Indicators folder with the new version and restart the platform to apply changes.
Frequently Asked Questions
Q: Why is my indicator not showing? A: Verify the file is in the MQL/Indicators folder, or try right-clicking the "Indicators" tree in the Navigator and clicking "Refresh."
Q: Do custom indicators slow down the platform? A: Too many complex indicators can impact performance; remove unused ones via the "Indicator List" (Ctrl+I).
Q: Can I use MT4 indicators on MT5? A: No, MQL4 and MQL5 are distinct languages; ensure the indicator is compiled specifically for your platform version.
Description & Settings
When volatility of the financial instrument became lower than some level, the long-,middle- and short-term strategies may lose profit and became unprofitable.
It depends how long will this "calm" - during these periods you may use scalper strategies based on hourly volatility. To find the patterns of market behavior you need a tools.
The
Size Highs And Lows
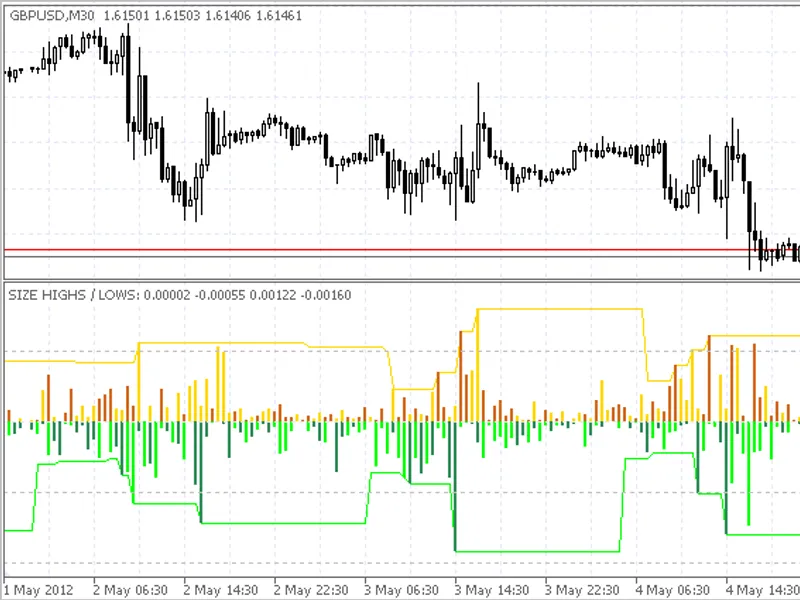
indicator shows the size of Highs and Lows and their values over the specified period (the values are calculated the same way as indicator).
Fig. 1. Size Highs And Lows indicator
The values>0 at the histogram show the size of the Highs. The bullish bars are plotted with yellow color, the bearish bars are plotted with brown color.
The values<0 at the histogram show the size of the Lows. Bearish bars are shown with light green, bullish bars are shown with green color.
The idea became clear if you look at this with indicator:
Fig. 2. Size Highs And Lows + Break Lag ATR indicators
One can see on the figure above, the increased volatility persists some time after the breakdown of the volatility. That's the time for usage of the scalper robot. The only thing to find is the patterns :)
Input parameters:
The indicator has only 2 input parameters (periods):