










RSI Histogram Indicator for MT5
Info
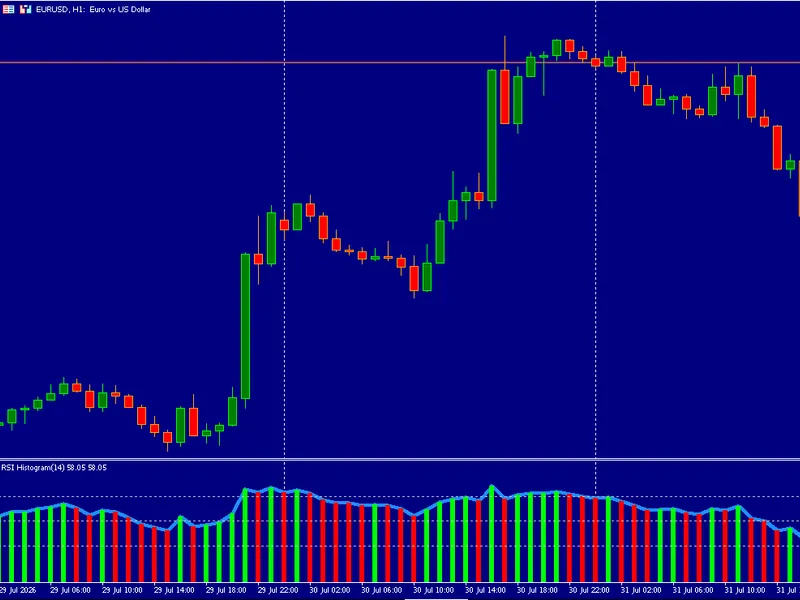
The RSI Histogram Indicator for MT5 is a Indicator for MetaTrader 5 that rsi histogramthis is a custom indicator for metatrader 5 that plots the classic rsi (relative strength index) in a separate window, while also adding a color-coded histogram based on the direction of the rsi's momentum. In effect, it combines a standard RSI with a "trend-colored RSI," making it easy to see at a glance whether RSI is rising, falling, or flat.
Usage
This tool is typically used for enhancing chart analysis and decision making.
Platform
This Indicator works exclusively on MetaTrader 5 (both build 600+ and newer versions).
Setup
Place the downloaded file in MQL5/Indicators folder via File ? Open Data Folder in MetaTrader 5.
How to Install and Use RSI Histogram Indicator for MT5
1. Installation: Place your file in the MQL/Indicators folder via "Open Data Folder" and restart your terminal.
2. Loading: Find the indicator in the Navigator, drag it onto your chart, and configure the input parameters in the popup window.
3. Customization: Press Ctrl+I to open the indicator list, select your tool, and click "Properties" to change colors, levels, or visual styles.
4. Updating: Replace the old file in the Indicators folder with the new version and restart the platform to apply changes.
Frequently Asked Questions
Q: Why is my indicator not showing? A: Verify the file is in the MQL/Indicators folder, or try right-clicking the "Indicators" tree in the Navigator and clicking "Refresh."
Q: Do custom indicators slow down the platform? A: Too many complex indicators can impact performance; remove unused ones via the "Indicator List" (Ctrl+I).
Q: Can I use MT4 indicators on MT5? A: No, MQL4 and MQL5 are distinct languages; ensure the indicator is compiled specifically for your platform version.
What this tool does
RSI HistogramThis is a custom indicator for MetaTrader 5 that plots the classic RSI (Relative Strength Index) in a separate window, while also adding a color-coded histogram based on the direction of the RSI's momentum.
Typical Use Case
This Indicator excels in automated trading and technical analysis on MetaTrader 5.
Compatible Platform & Setup
This Indicator works on MetaTrader 5. Place the file in the MQL5/Indicators folder and restart the terminal.
Description & Settings
Related: Quantora ADR Calculator MT5 - Professional Average Daily Range Indicator - another powerful indicator for MetaTrader 5 traders.
RSI HistogramAlso recommended: Session High-Low Indicator for MetaTrader - similar indicator with strong performance on MetaTrader 5.
This is a custom indicator for MetaTrader 5 that plots the classic RSI (Relative Strength Index) in a separate window, while also adding a color-coded histogram based on the direction of the RSI's momentum.
In effect, it combines a standard RSI with a "trend-colored RSI," making it easy to see at a glance whether RSI is rising, falling, or flat.
Explanation of each input
RSI group
Show_RSI
(true/false) — shows or hides the classic RSI line (the solid blue line).
RSI_Period
(default 14) — the number of bars used to calculate the average gain/loss (Wilder's method). A shorter period makes RSI more sensitive/noisy; a longer period makes it smoother but more lagging.
RSI_Price
(default PRICE_CLOSE) — which price is used in the calculation: close, open, high, low, median (H+L)/2, typical (H+L+C)/3, or weighted (H+L+2C)/4.
RSI_Color — the color of the RSI line.
RSI_Width — the line thickness of RSI (automatically clamped between 1 and 5).
Histogram group
Show_Histogram — shows or hides the colored histogram.
Histogram_Width — thickness of the histogram bars (1–5).
Momentum_Filter
(default 0.01) — the minimum RSI change between two bars required to classify the move as "rising" or "falling." Below this threshold, the bar is treated as "flat" (neutral). This keeps the histogram from flickering color on tiny noise fluctuations.
Color_Up / Color_Down / Color_Flat — colors for the histogram when RSI is rising, falling, or stationary.
Levels group
Show_Levels — shows or hides the three horizontal reference lines.
Upper_Level
(default 70) — typically the "overbought" threshold.
Middle_Level
(default 50) — the midline, used as a neutral bull/bear threshold.
Lower_Level
(default 30) — the "oversold" threshold. (The code auto-corrects if levels are entered out of order or outside the 0–100 range.)
Performance group
Maximum_Bars
(default 10000, 0 = no limit) — limits how many bars of history are recalculated on each tick, for performance on charts with very long history. The indicator re-seeds the Wilder average right at the window boundary, so RSI stays mathematically correct instead of accumulating drift.
Applicable trading methods
This indicator is a visual variant of classic RSI, so standard RSI strategies apply, plus a few ideas specific to the color histogram:
Classic overbought/oversold
RSI above Upper_Level (70) → asset possibly overbought → look for sell/short signals.
RSI below Lower_Level (30) → possibly oversold → look for buy/long signals.
The shorter the RSI period, the more often these extremes occur (but also more false signals).
Midline (50) crossovers
RSI crossing above 50 = bullish momentum confirmation.
RSI crossing below 50 = bearish momentum confirmation.
Useful as a trend filter rather than a direct entry/exit trigger.
Reading the momentum histogram (specific to this indicator)
Consecutive green bars = RSI accelerating upward → buying momentum strengthening.
Consecutive red bars = selling momentum strengthening.
Gold (flat) bars = RSI stagnating → possible indecision/consolidation zone, a cue for caution before entering a position.
A color flip (green→red or vice versa) can serve as an early warning that the current move is losing steam, even before RSI reaches an extreme level.
Divergences
(not calculated automatically by the indicator, but visible manually)
Price makes a new high but RSI/histogram makes a lower high → bearish divergence, possible exhaustion of the uptrend.
Price makes a new low but RSI makes a higher low → bullish divergence.
Using Momentum_Filter as a noise filter
Increasing Momentum_Filter makes the histogram more conservative (flat color shows up more often) — useful to avoid false signals in choppy/sideways markets.
Decreasing the threshold makes the histogram react to any minor move — useful on shorter timeframes (scalping).
Note:
like any RSI-based tool, this indicator works best combined with other confirmation (price structure, moving averages, volume) rather than in isolation — RSI alone can stay in overbought/oversold territory for a long time during strong trends, generating premature signals.
You may also like: Volatility Regime Indicator - excellent alternative for indicator users on MetaTrader 5.
Source Code
#property copyright "RobotFX"
#property link "https://robotfx.org"
#property version   "2.10"
#property strict
#property indicator_separate_window
#property indicator_minimum 0
#property indicator_maximum 100
#property indicator_buffers 5
#property indicator_plots   2
#property indicator_label1  "RSI"
.......
⚠ Limitations & Risk Warning
- This tool is provided for educational and testing purposes only.
- Past performance does not guarantee future results.
- Trading involves substantial risk of loss. Use on a demo account first.
- Results may vary depending on market conditions, broker, and settings.
- We recommend thorough backtesting and forward testing before using with real funds.