Relative Vigor Index (RV I)
Info
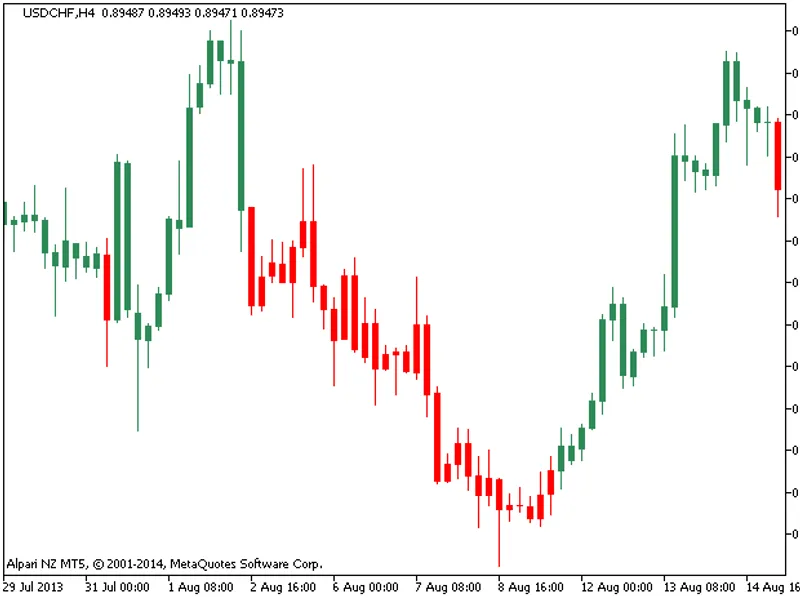
The Relative Vigor Index (RV I) is a Indicator for MetaTrader 5 that the main point of relative vigor index (rvi) technical indicator is that on the bull market the closing price is, as a rule, higher, than the opening price. It is the other way round on the bear market.
Usage
This tool is typically used for enhancing chart analysis and decision making.
Platform
This Indicator works exclusively on MetaTrader 5 (both build 600+ and newer versions).
Setup
Place the downloaded file in MQL5/Indicators folder via File ? Open Data Folder in MetaTrader 5.
How to Install and Use Relative Vigor Index (RV I)
1. Installation: Place your file in the MQL/Indicators folder via "Open Data Folder" and restart your terminal.
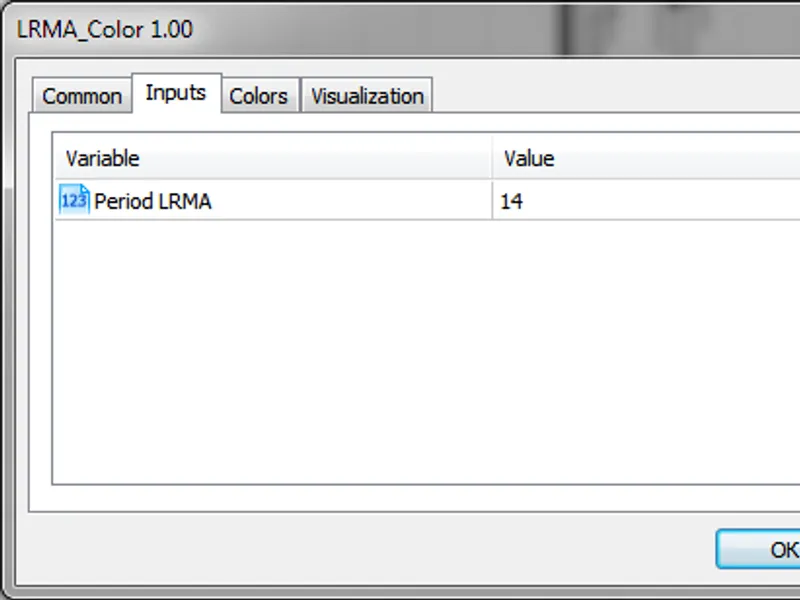
2. Loading: Find the indicator in the Navigator, drag it onto your chart, and configure the input parameters in the popup window.
3. Customization: Press Ctrl+I to open the indicator list, select your tool, and click "Properties" to change colors, levels, or visual styles.
4. Updating: Replace the old file in the Indicators folder with the new version and restart the platform to apply changes.
Frequently Asked Questions
Q: Why is my indicator not showing? A: Verify the file is in the MQL/Indicators folder, or try right-clicking the "Indicators" tree in the Navigator and clicking "Refresh."
Q: Do custom indicators slow down the platform? A: Too many complex indicators can impact performance; remove unused ones via the "Indicator List" (Ctrl+I).
Q: Can I use MT4 indicators on MT5? A: No, MQL4 and MQL5 are distinct languages; ensure the indicator is compiled specifically for your platform version.
What this tool does
The main point of Relative Vigor Index (RVI) technical indicator is that on the bull market the closing price is, as a rule, higher, than the opening price.
Typical Use Case
This Indicator excels in automated trading and technical analysis on MetaTrader 5.
Compatible Platform & Setup
This Indicator works on MetaTrader 5. Place the file in the MQL5/Indicators folder and restart the terminal.
Description & Settings
Related: Relative Strength Index of Volatility - another powerful indicator for MetaTrader 5 traders.
The main point of Relative Vigor Index (RVI) technical indicator is that on the bull market the closing price is, as a rule, higher, than the opening price.
Also recommended: Relative Strength Index (RS I) - similar indicator with strong performance on MetaTrader 5.
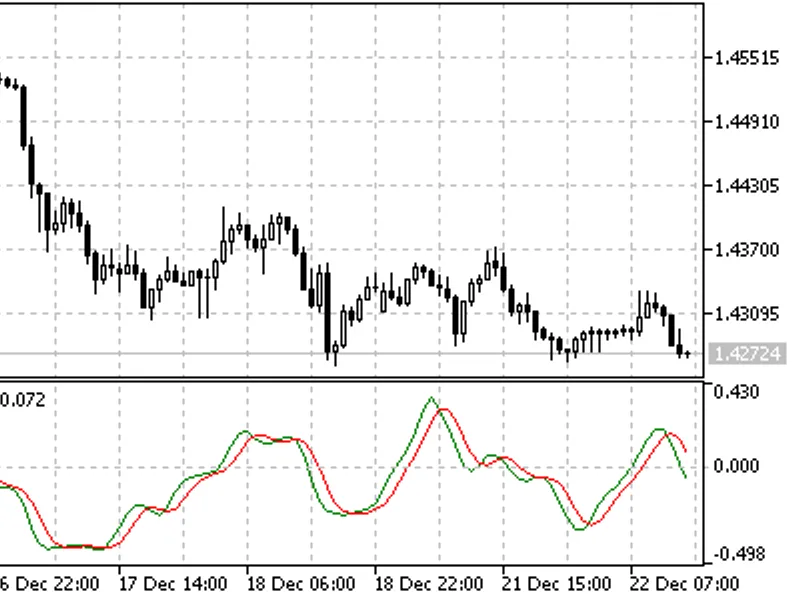
It is the other way round on the bear market. So the idea behind Relative Vigor Index is that the vigor, or energy, of the move is thus established by where the prices end up at the close.To normalize the index to the daily trading range, divide the change of price by the maximum range of prices for the day. To make a more smooth calculation, one uses Simple Moving Average. 10 is considered the best period. To avoid probable ambiguity one needs to construct a signal line, which is a 4-period symmetrically weighted moving average of Relative Vigor Index values. The concurrence of lines serves as a signal to buy or to sell.
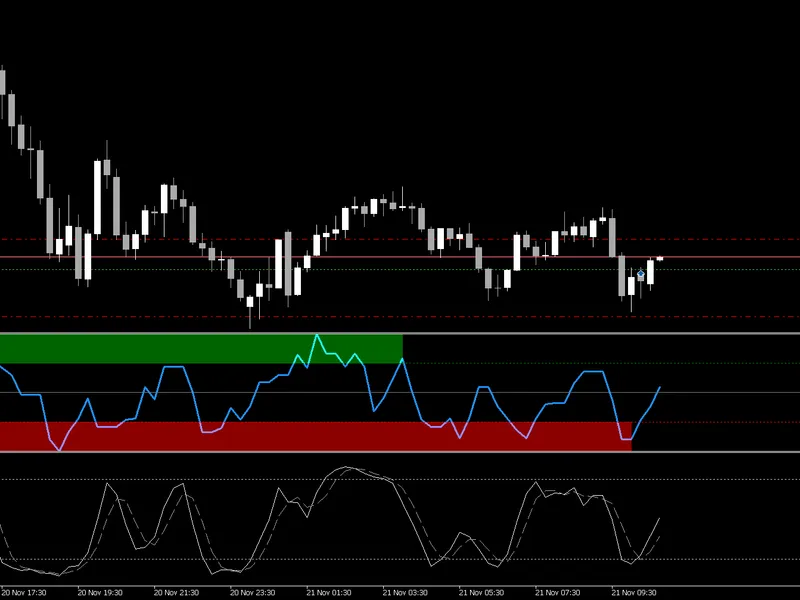
Relative Vigor Index indicator
Calculation:
RVI is calculated similarly to Stochastic Oscillator.
However, the Vigor Index compares close levels relative to opening levels, and not the minimal price as is done by Stochastic. The indicator is calculated as the value equal to the actual price change for the period, normalized to the maximal range of price change for this period, for example a day or hour.
RVI = (CLOSE - OPEN) / (HIGH - LOW)
where:
OPEN - opening price;HIGH - highest price;LOW - lowest price;CLOSE - closing price.
Usually RVI is displayed as two lines:
1. The first one is build the same as RVI, but instead of Close and Open price difference and High and Low price difference sums of 4-period symmetrically weighted moving averages are used. I.e. the 4-period symmetrically weighted average of a numerator is calculated:
MovAverage = (CLOSE-OPEN) + 2 * (CLOSE-1 - OPEN-1) + 2 * (CLOSE-2 - OPEN-2) + (CLOSE-3 - OPEN-3)
where:
CLOSE - current close price;
CLOSE-1, CLOSE-2, CLOSE-3 - close prices 1, 2 and 3 periods ago;
OPEN - current open price;
OPEN-1, OPEN-2, OPEN-3 - open prices 1, 2 and 3 periods ago.
Then the 4-period symmetrically weighted moving average of a denominator is found:
RangeAverage = (HIGH-LOW) + 2 x (HIGH-1 - LOW-1) + 2 x (HIGH-2 - LOW-2) + (HIGH-3 - LOW-3),
where:
HIGH - maximal price of the last bar;
HIGH, HIGH-2, HIGH-3 - maximal prices 1, 2 and 3 periods ago;
LOW - minimal price of the last bar;
LOW-1, LOW-2, LOW-3 - minimal prices 1, 2 and 3 periods ago.
After that we calculate the sum of these moving averages for tha last 4 periods, for example hours or days:
2. The second line is the 4-period symmetrically weighted moving average of the first line:
RVIsignal = (RVIaverage + 2 * RVIaverage-1 + 2 * RVIaverage-2 + RVIaverage-3)/6
You may also like: True RV I - Relative Strength Index (liveliness) of market - excellent alternative for indicator users on MetaTrader 5.
⚠ Limitations & Risk Warning
- This tool is provided for educational and testing purposes only.
- Past performance does not guarantee future results.
- Trading involves substantial risk of loss. Use on a demo account first.
- Results may vary depending on market conditions, broker, and settings.
- We recommend thorough backtesting and forward testing before using with real funds.