Relative Strength Levy
This software component for MetaTrader 4 is built to enhance the capabilities of your trading environment. This technical indicator acts as a specialized analysis tool designed to visualize market data. It helps traders identify emerging trends, momentum shifts, and key support or resistance levels by plotting statistical calculations directly onto price charts.
How to Setup and Use Relative Strength Levy
1. Installation: Place your file in the MQL/Indicators folder via "Open Data Folder" and restart your terminal.
2. Loading: Find the indicator in the Navigator, drag it onto your chart, and configure the input parameters in the popup window.
3. Customization: Press Ctrl+I to open the indicator list, select your tool, and click "Properties" to change colors, levels, or visual styles.
4. Updating: Replace the old file in the Indicators folder with the new version and restart the platform to apply changes.
Frequently Asked Questions
Q: Why is my indicator not showing? A: Verify the file is in the MQL/Indicators folder, or try right-clicking the "Indicators" tree in the Navigator and clicking "Refresh."
Q: Do custom indicators slow down the platform? A: Too many complex indicators can impact performance; remove unused ones via the "Indicator List" (Ctrl+I).
Q: Can I use MT4 indicators on MT5? A: No, MQL4 and MQL5 are distinct languages; ensure the indicator is compiled specifically for your platform version.
Description & Settings
Description:
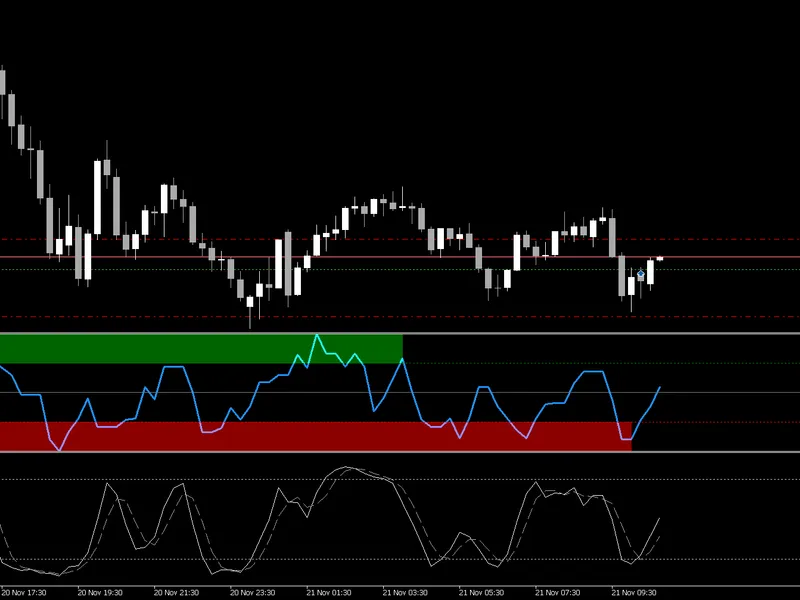
The concept of Relative Strength to Levy is based on the assumption that, securities which exhibited a large relative strength in the past will also develop relatively strongly in future, and conversely.It is compare on the performance of the past with the performance of last observation period.
Calculation:
Arithmetic mean of the candle closing price over the observation period. The result is plotted around the 1.0 mark.
C is Close and MA is the Moving Average.
Interpretation:
If an instrument has an RSL of greater than 1, it is more likely than not, the instrument is more than weak in the past.
Second interpretation of Levy is to first divide the standard deviations of the last 27 weekly closing prices. The intention of this method is to determine the volatility of the securities being observed.