Price Volume Divergence
This is a powerful addition to your MetaTrader 5 toolkit designed to optimize market analysis and performance. This technical indicator acts as a specialized analysis tool designed to visualize market data. It helps traders identify emerging trends, momentum shifts, and key support or resistance levels by plotting statistical calculations directly onto price charts.
How to Setup and Use Price Volume Divergence
1. Installation: Place your file in the MQL/Indicators folder via "Open Data Folder" and restart your terminal.
2. Loading: Find the indicator in the Navigator, drag it onto your chart, and configure the input parameters in the popup window.
3. Customization: Press Ctrl+I to open the indicator list, select your tool, and click "Properties" to change colors, levels, or visual styles.
4. Updating: Replace the old file in the Indicators folder with the new version and restart the platform to apply changes.
Frequently Asked Questions
Q: Why is my indicator not showing? A: Verify the file is in the MQL/Indicators folder, or try right-clicking the "Indicators" tree in the Navigator and clicking "Refresh."
Q: Do custom indicators slow down the platform? A: Too many complex indicators can impact performance; remove unused ones via the "Indicator List" (Ctrl+I).
Q: Can I use MT4 indicators on MT5? A: No, MQL4 and MQL5 are distinct languages; ensure the indicator is compiled specifically for your platform version.
Description & Settings
Indicator Price volume divergence compares the sizes and volumes of the current bar and of the preceding bar and, provided that there is a difference between them, places signal pointers.
It has five adjustable parameters:
Use alerts
- use alerts
Send push-notifications
- send push notifications to your mobile device
Applied volume
- volume used by the indicator
Show volumes bars
- show volumes on the price chart
Calculations:
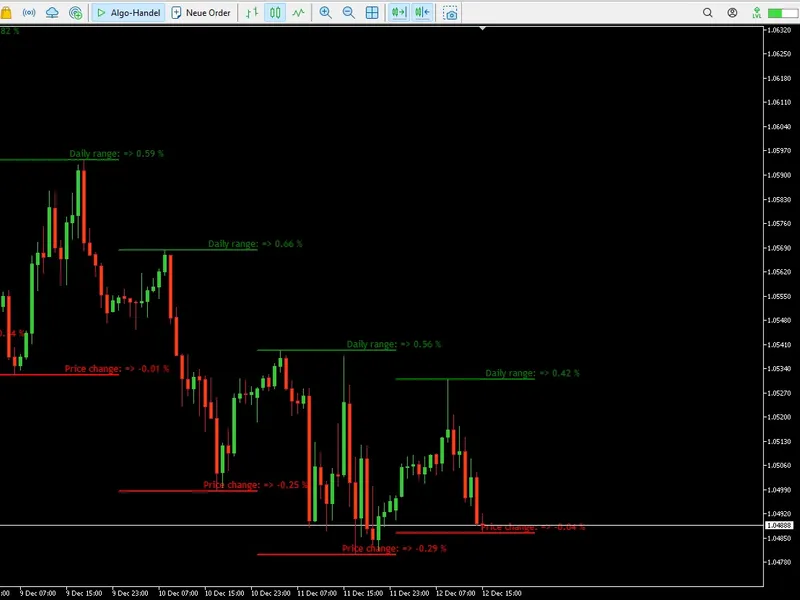
If the size of the current candle exceeds that of the preceding one and the volume of the current candle is smaller than that of the preceding one,then this is considered to be the growing divergence and the green signal pointer is place on the candle High
If the size of the current candle is smaller than that of the preceding one and the volume of the current candle exceeds that of the preceding one,then this is considered to be the falling divergence and the red signal pointer is placed on the candle Low
It should be understood that signal pointer do not indicate the dierection of opening a position; they just indicate the type (growing/falling) of the divergences among the sizes and volumes of the current candle and the preceding candle.