Price prediction by Nearest Neighbor
This tool for MetaTrader 5 is specifically engineered to streamline your trading operations. This technical indicator acts as a specialized analysis tool designed to visualize market data. It helps traders identify emerging trends, momentum shifts, and key support or resistance levels by plotting statistical calculations directly onto price charts.
How to Setup and Use Price prediction by Nearest Neighbor
1. Installation: Place your file in the MQL/Indicators folder via "Open Data Folder" and restart your terminal.
2. Loading: Find the indicator in the Navigator, drag it onto your chart, and configure the input parameters in the popup window.
3. Customization: Press Ctrl+I to open the indicator list, select your tool, and click "Properties" to change colors, levels, or visual styles.
4. Updating: Replace the old file in the Indicators folder with the new version and restart the platform to apply changes.
Frequently Asked Questions
Q: Why is my indicator not showing? A: Verify the file is in the MQL/Indicators folder, or try right-clicking the "Indicators" tree in the Navigator and clicking "Refresh."
Q: Do custom indicators slow down the platform? A: Too many complex indicators can impact performance; remove unused ones via the "Indicator List" (Ctrl+I).
Q: Can I use MT4 indicators on MT5? A: No, MQL4 and MQL5 are distinct languages; ensure the indicator is compiled specifically for your platform version.
Description & Settings
The k-Nearest Neighbor algorithm (k-NN) searches for k past patterns (neighbors) that are most similar to the current pattern and computes the future prices based on weighted voting of those neighbors. The present indicator finds only one nearest neighbor. So, in essence, it is a 1-NN algorithm. It uses the Pearson correlation coefficient between the current pattern and all past patterns as the measure of distance between them.
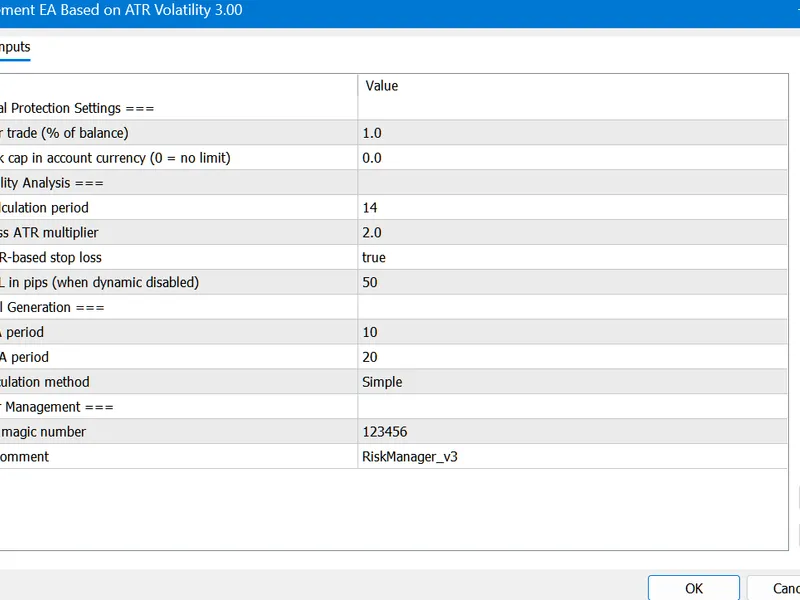
The indicator has the following input parameters:
Npast - number of past bars in a pattern;
Nfut -number of future bars in a pattern (must be < Npast).
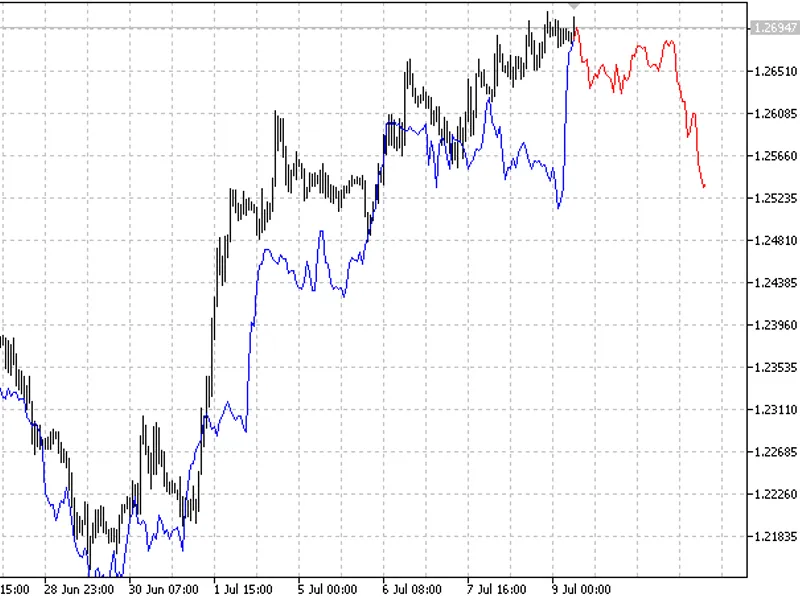
The indicator plots two curves: the blue curve indicates the past prices of the nearest neighbour and the red curve indicates the future prices of the same pattern. The nearest neighbour is scaled according to the linear regression slope between this pattern and the current pattern. The indicator also prints the information about the starting date of the nearest neighbor and its correlation coefficient to the present pattern. For example,
Nearest_Neighbor (EURUSD,H1): Nearest neighbor is dated 2003.08.26 23:00:00 and has correlation with current pattern of 0.9432442047577905;
Image: