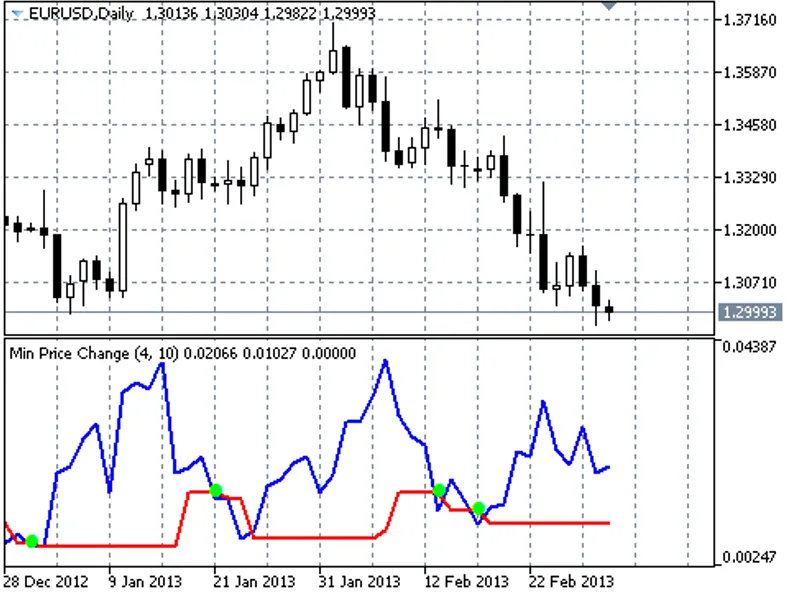
Min Price Change
This professional-grade solution for MetaTrader 5 helps traders achieve greater efficiency in their daily workflow. This technical indicator acts as a specialized analysis tool designed to visualize market data. It helps traders identify emerging trends, momentum shifts, and key support or resistance levels by plotting statistical calculations directly onto price charts.
How to Setup and Use Min Price Change
1. Installation: Place your file in the MQL/Indicators folder via "Open Data Folder" and restart your terminal.
2. Loading: Find the indicator in the Navigator, drag it onto your chart, and configure the input parameters in the popup window.
3. Customization: Press Ctrl+I to open the indicator list, select your tool, and click "Properties" to change colors, levels, or visual styles.
4. Updating: Replace the old file in the Indicators folder with the new version and restart the platform to apply changes.
Frequently Asked Questions
Q: Why is my indicator not showing? A: Verify the file is in the MQL/Indicators folder, or try right-clicking the "Indicators" tree in the Navigator and clicking "Refresh."
Q: Do custom indicators slow down the platform? A: Too many complex indicators can impact performance; remove unused ones via the "Indicator List" (Ctrl+I).
Q: Can I use MT4 indicators on MT5? A: No, MQL4 and MQL5 are distinct languages; ensure the indicator is compiled specifically for your platform version.
Description & Settings
It is based on the idea of flat and trend movements' alteration. In other words, MinPriceChange is another indicator which sends signals as the price moved for some time aside and either continuation, or reversal is expected. Algorithm for calculation is in the following:
calculate the sum of price changes on each bar for the specified period , i.e. the sum of differences (close[i] - close[i-1]).
if the sum of price changes calculated on the current bar is less than the minimum sum calculated on the previous bars, then consider it a signal of a passed flat and starting breakthrough of boundaries of the current flat.
It should be noted that the idea of creation of the indicator is also "inspired" by the indicator. Well, perhaps, that is all what they have in common. It is a comparison of the current calculated value with the minimum value from the previously calculated ones. To my point of view, the idea is rather good and allows connecting not to any other values specified by the trader, but to a certain value determined by the market.
Parameters:
Changes Period
- period for calculation of sum of price changes (on the current bar).
Check Period
- period for detecting the minimum sum of changes.
Abs Change
- if the parameter is true, we will summarize absolute values of changes, if false, we will summarize changes with the corresponding sign (+/-).
Recommendations:
It is not recommended to use the indicator on the small ("noise") frames.
The indicator doesn't specify the direction, so two variants of use are available as the signal is formed:
place stop orders at the boundaries of the signal range (i.e. above the maximum high and the minimum low of the last "Change Period" bars),
use in pair with any trend indicator and place stop order only in the trend direction (if there was a breakthrough in the opposite direction, delete stop order).