Quantile Price Analysis
This tool for MetaTrader 4 is specifically engineered to streamline your trading operations. This technical indicator acts as a specialized analysis tool designed to visualize market data. It helps traders identify emerging trends, momentum shifts, and key support or resistance levels by plotting statistical calculations directly onto price charts.
How to Setup and Use Quantile Price Analysis
1. Installation: Place your file in the MQL/Indicators folder via "Open Data Folder" and restart your terminal.
2. Loading: Find the indicator in the Navigator, drag it onto your chart, and configure the input parameters in the popup window.
3. Customization: Press Ctrl+I to open the indicator list, select your tool, and click "Properties" to change colors, levels, or visual styles.
4. Updating: Replace the old file in the Indicators folder with the new version and restart the platform to apply changes.
Frequently Asked Questions
Q: Why is my indicator not showing? A: Verify the file is in the MQL/Indicators folder, or try right-clicking the "Indicators" tree in the Navigator and clicking "Refresh."
Q: Do custom indicators slow down the platform? A: Too many complex indicators can impact performance; remove unused ones via the "Indicator List" (Ctrl+I).
Q: Can I use MT4 indicators on MT5? A: No, MQL4 and MQL5 are distinct languages; ensure the indicator is compiled specifically for your platform version.
Description & Settings
Calculation is:
----------------------
Calculation is current close price minus the close price of the last N(default 30) period's defined X(default 60) upper quantile &
current close price minus the close price of the last N(default 30) period's defined X(default 40) lower quantile.
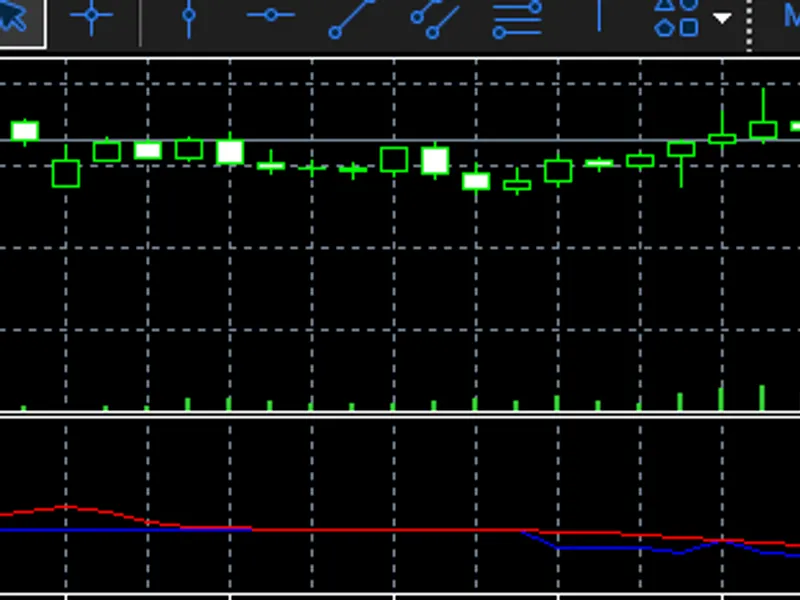
If both of these value(which are displayed in histograms) are above 0 then it is uptrend, vice versa for down trend, if one of them is > 0 and one of them is < 0, then it is ranging.
-----------------------
There is also a high low mode in the inputs, Calculation is current High price minus the close price of the last N(default 30) period's defined X(default 60) upper quantile & current Low price minus the close price of the last N(default 30) period's defined X(default 40) lower quantile.
If both of these value(which are displayed in histograms) are above 0 then it is uptrend, vice versa for down trend, if one of them is > 0 and one of them is < 0, then it is ranging.
This method filters more ranging bars but also produces more lag.
-----------------------Green Block at the 0 level means uptrend, Orange Block at the 0 level means downtrend, Gray Block at the 0 level means Ranging.