Find Pin Bars
This professional-grade solution for MetaTrader 5 helps traders achieve greater efficiency in their daily workflow. This technical indicator acts as a specialized analysis tool designed to visualize market data. It helps traders identify emerging trends, momentum shifts, and key support or resistance levels by plotting statistical calculations directly onto price charts.
How to Setup and Use Find Pin Bars
1. Installation: Place your file in the MQL/Indicators folder via "Open Data Folder" and restart your terminal.
2. Loading: Find the indicator in the Navigator, drag it onto your chart, and configure the input parameters in the popup window.
3. Customization: Press Ctrl+I to open the indicator list, select your tool, and click "Properties" to change colors, levels, or visual styles.
4. Updating: Replace the old file in the Indicators folder with the new version and restart the platform to apply changes.
Frequently Asked Questions
Q: Why is my indicator not showing? A: Verify the file is in the MQL/Indicators folder, or try right-clicking the "Indicators" tree in the Navigator and clicking "Refresh."
Q: Do custom indicators slow down the platform? A: Too many complex indicators can impact performance; remove unused ones via the "Indicator List" (Ctrl+I).
Q: Can I use MT4 indicators on MT5? A: No, MQL4 and MQL5 are distinct languages; ensure the indicator is compiled specifically for your platform version.
Description & Settings
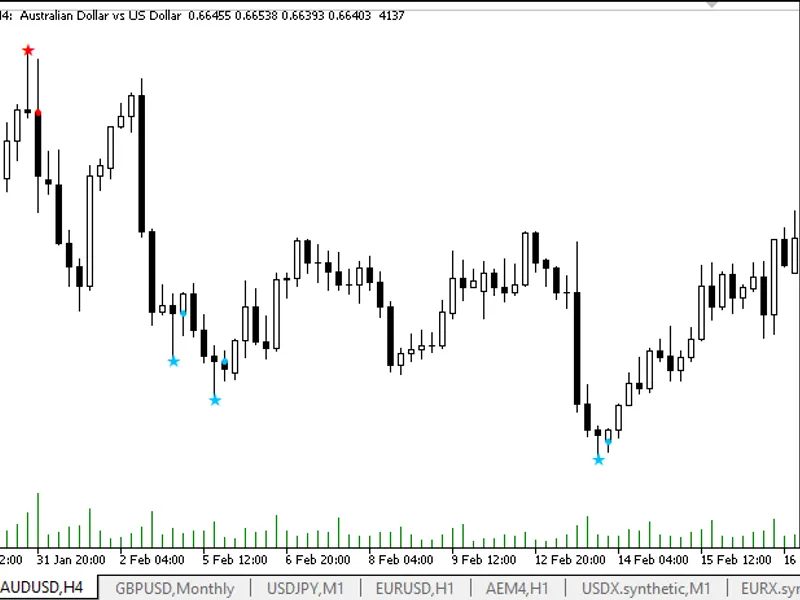
A Pin Bar is a candlestick with a small body and a long shadow, which often indicates a possible price reversal.
The indicator searches the chart for Price Action Pin Bar patterns and puts icons on the bar with the found patterns:
To eliminate over-drawing signals, patterns are looked for on a past bar. If a Pin Bar is found, a signal arrow is placed on the current bar - at the opening price of the current bar. The indicator only searches for Pin Bars according to the rules of their formation. Accordingly, it is necessary to use some other indicator for filtering and confirmation, for example, an indicator of key and important levels.
It has four adjustable parameters:
Minimum size of a
candle
from low to high
- Minimum size of
a
candle (in pips). Sets the minimum allowed height of a candle being analysed (the difference between High and Low). Candles of smaller size are ignored by the indicator, which allows to exclude low-value or "noise" candles. Increase the value to filter weak signals on low-volatility markets;
Maximum size of the candle body relative to its shadows
- Maximum size of the candle body (relative to the size of the whole candle, from 0 to 1). Defines the maximum allowable size of the candle body (difference between Open and Close) relative to the full height of the candle. The smaller the value, the more pronounced will be the signals with long shadows and a small body - classic Pin Bars. To find the most "clean" Pin Bars, use values 0.2 - 0.4;
Position of the body relative to the previous
candle (from 0 to 1). The parameter defines how deep the Pin Bar body can go into the range of the previous candle. The smaller the value, the closer the body will be to the edge of the range, which corresponds to classic reversal patterns. Use values 0.2-0.4 to search for signals where the Pin Bar body is located near the border of the previous candle;
Aspect ratio of the shadows
(coefficient) Sets the minimum ratio between the length of the main shadow (upper for Pin Bar for Sell, lower for Pin Bar for Buy) and the opposite shadow. The higher the value, the more pronounced should be the main shadow compared to the opposite shadow. Values 1.5 - 2.5 allow filtering signals, leaving only candles with a pronounced long shadow.
Principles of searching and displaying patterns in the indicator code:
Analyses each candle on the chart and compares it with previous ones.
Finds candlesticks that have a small body and one of the shadows (upper or lower) is much longer than the other.
Checks that the body of the candlestick is inside the range of the previous candlestick - this is important for a classic Pin-Bar.
If the candle meets all the criteria, the indicator marks it with an arrow on the chart:
Blue arrow - Pin Bar
to
Buy (long lower shadow) on the previous bar (
PinBar to Up
buffer 0) and blue signal arrow on the current bar (
Signal Buy
buffer 2).
Red arrow - Pin-Bar to Sell (long upper shadow) on the previous bar (buffer 1 PinBar
to Down
) and red signal arrow on the current bar (buffer 3
Signal Sell
).
Recommendations on parameter settings:
For more rigorous selection of signals
increase"Minimum size of a candle from low to high" and"Aspect ratio of the shadows",
decrease"Maximum size of the candle body relative to its shadows" and"Position of the body relative to the previous candle".
For more signals
decrease"Minimum size of a candle from low to high" and"Aspect ratio of the shadows",
increase"Maximum size of the candle body relative to its shadows" and"Position of the body relative to the previous candle".
Select the parameters based on the volatility of the instrument and timeframe, so that the indicator finds the most relevant Pin Bars for your strategy.
Buffer numbers for reading from another programme:
Buffer 0 (Name PinBar
to Up
) - labels Pin_Bars to buy,
Buffer 1 (Name PinBar
to Down
) - Pin_Bar labels for Sell,
Buffer 2 (Name
Signal
Buy) - signal arrow to buy,
Buffer 3 (Name
Signal
Sell
) - signal arrow to sell,
To get signals from the Expert Advisor, use Buffers 2 and 3 for Buy and Sell signals respectively. The values in these buffers appear on the current bar and contain its opening price. At the same time, the previous bar contains the description of the found pattern. If a non-empty value is in buffer 0, it is a Buy Pin Bar, if the value in buffer 1 is a Sell Pin Bar.
Adjust the parameters according to your requirements to the quality and frequency of signals, so that the indicator matches your trading strategy as much as possible.