Previous Day highs and lows
This software component for MetaTrader 5 is built to enhance the capabilities of your trading environment. This technical indicator acts as a specialized analysis tool designed to visualize market data. It helps traders identify emerging trends, momentum shifts, and key support or resistance levels by plotting statistical calculations directly onto price charts.
How to Setup and Use Previous Day highs and lows
1. Installation: Place your file in the MQL/Indicators folder via "Open Data Folder" and restart your terminal.
2. Loading: Find the indicator in the Navigator, drag it onto your chart, and configure the input parameters in the popup window.
3. Customization: Press Ctrl+I to open the indicator list, select your tool, and click "Properties" to change colors, levels, or visual styles.
4. Updating: Replace the old file in the Indicators folder with the new version and restart the platform to apply changes.
Frequently Asked Questions
Q: Why is my indicator not showing? A: Verify the file is in the MQL/Indicators folder, or try right-clicking the "Indicators" tree in the Navigator and clicking "Refresh."
Q: Do custom indicators slow down the platform? A: Too many complex indicators can impact performance; remove unused ones via the "Indicator List" (Ctrl+I).
Q: Can I use MT4 indicators on MT5? A: No, MQL4 and MQL5 are distinct languages; ensure the indicator is compiled specifically for your platform version.
Description & Settings
The
Previous Day High Low
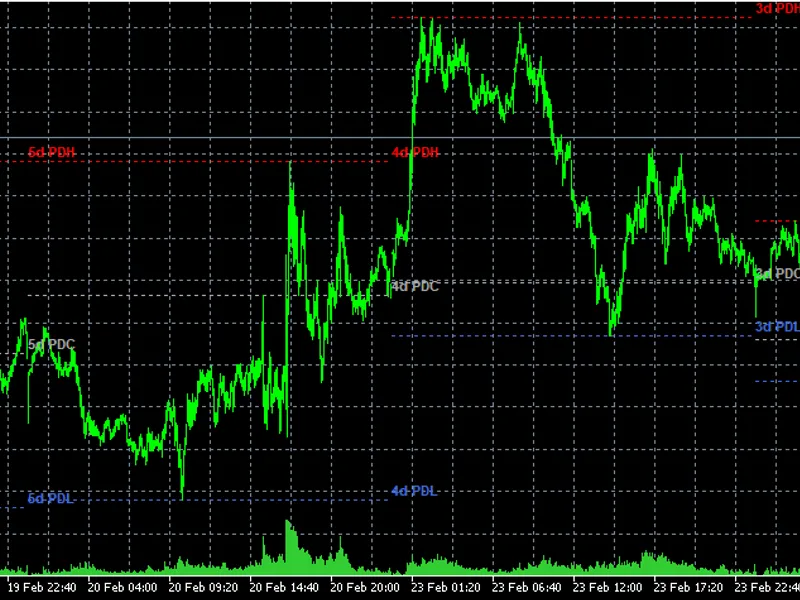
indicator automatically marks the High, Low, and Close of each previous trading day directly on the chart. Each day's levels are drawn as clean horizontal lines within their own day range, giving traders an immediate visual reference of where price was capped and supported on prior sessions. Yesterday's lines extend to the right across today's chart as live reference levels.
The concept behind this indicator is one of the most fundamental ideas in professional trading: previous day levels act as natural support and resistance. Market makers, banks, and institutional traders are well aware of where yesterday's high and low sit, and price frequently reacts at these levels. Having them clearly marked removes the need for manual analysis every morning and keeps the chart clean and focused.
The indicator draws up to 50 days of historical levels, each contained within its own day. Yesterday's lines are solid and extend to the right so they remain visible as today's price develops. Older days use a dotted style to distinguish them from the most recent reference levels. An optional alert fires once per day when price touches any of yesterday's key levels.
How to Use
Apply the indicator to any Forex pair on any timeframe. The levels are read directly from the Daily timeframe internally, so they are accurate regardless of the chart timeframe you are viewing. The recommended timeframe is H1 or H4 for the clearest view of how price interacts with the previous day levels.
Reading the lines:
PDH
— Previous Day High: key resistance level, watch for rejections or breakouts
PDL
— Previous Day Low: key support level, watch for bounces or breakdowns
PDC
— Previous Day Close: equilibrium level, often acts as a pivot during early session
Labels on older days show
2d PDH
,
3d PDH
etc. to indicate how many days back
Trading ideas:
Price opening above PDH is a bullish signal — look for long entries on a retest of PDH as support
Price opening below PDL is a bearish signal — look for short entries on a retest of PDL as resistance
The PDC level often acts as the first target or barrier during the London open
A breakout above multiple stacked PDH levels signals strong bullish momentum Input Parameters Important Notes
Levels are read from the
Daily timeframe
internally. The chart timeframe does not affect accuracy.
Yesterday's lines are
solid and extend to the right
. Older day lines are dotted and contained within their own day for easy visual distinction.
Touch alerts fire
once per level per day
within a 0.5 pip tolerance and reset automatically at midnight server time.
On weekends or days with no trading data, the indicator automatically skips that day and moves to the next valid session.