High, Low and Close of the previous day, week or month
This is a powerful addition to your MetaTrader 4 toolkit designed to optimize market analysis and performance. This technical indicator acts as a specialized analysis tool designed to visualize market data. It helps traders identify emerging trends, momentum shifts, and key support or resistance levels by plotting statistical calculations directly onto price charts.
How to Setup and Use High, Low and Close of the previous day, week or month
1. Installation: Place your file in the MQL/Indicators folder via "Open Data Folder" and restart your terminal.
2. Loading: Find the indicator in the Navigator, drag it onto your chart, and configure the input parameters in the popup window.
3. Customization: Press Ctrl+I to open the indicator list, select your tool, and click "Properties" to change colors, levels, or visual styles.
4. Updating: Replace the old file in the Indicators folder with the new version and restart the platform to apply changes.
Frequently Asked Questions
Q: Why is my indicator not showing? A: Verify the file is in the MQL/Indicators folder, or try right-clicking the "Indicators" tree in the Navigator and clicking "Refresh."
Q: Do custom indicators slow down the platform? A: Too many complex indicators can impact performance; remove unused ones via the "Indicator List" (Ctrl+I).
Q: Can I use MT4 indicators on MT5? A: No, MQL4 and MQL5 are distinct languages; ensure the indicator is compiled specifically for your platform version.
Description & Settings
Metatrader 5:
Follow on instagram:
The indicator shows the High, Close and Low of the previous day, week or month. These levels are very commonly used as support and resistance among traders, so the indicator will draw them and leave a gap between periods to make it easy to distinguish when a new one started.
Update 1.1: Added some optimizations.
Update 1.1.1: Fixed compilation error in newer metatrader compilers.
Settings:
Precision:
Which timeframe must be used to calculate the High, Close and Low of the period. This setting is required when time shift is applied, otherwise, it can be ignored. For example, if you want the indicator to
calculate the GMT 0
High, Close and Low for the period on a
GMT 2 broker
, you would need to set the
Hour shift to -2
and
Precision to H1
to allow the indicator to use the hourly chart for its calculation, it'll affect the closing value, so choose wisely.
Period:
Previous day, previous week or previous month, you can only choose one of them. Add more instances of the indicator if want all modes drawn.
Periods to calculate:
Specifies how many days, weeks or months should be drawn on the chart. This way, only the relevant prices will be calculated.
Hours shift:
Self explanatory. Be aware that it'll require
Precision
to be set to at least H1.
Minutes shift:
Self explanatory. Be aware that it'll require
Precision
to be set at a multiple of the minutes shift, e.g: A 15 minutes shift requires precision to be set at least to M15.
Ignore Sunday:
Sunday bars will be merged into Monday. Affects only the previous day mode.
Ignore Saturday:
Saturday bars will be merged into Friday. Affects only the previous day mode.
Buffer visibility:
Show/hide any of the lines if required.
Probe visibility:
Show/hide any of the value tags.
Probe size:
Value tag size.
Data window label:
Text displayed in the data window and tool tip for each line.
IMPORTANT:
When timeshift and precision settings are used, the indicator may display the incorrect levels for a few seconds, this is because MetaTrader is downloading the required bars. So, if you use the H1 for precision, check if the bars were downloaded.
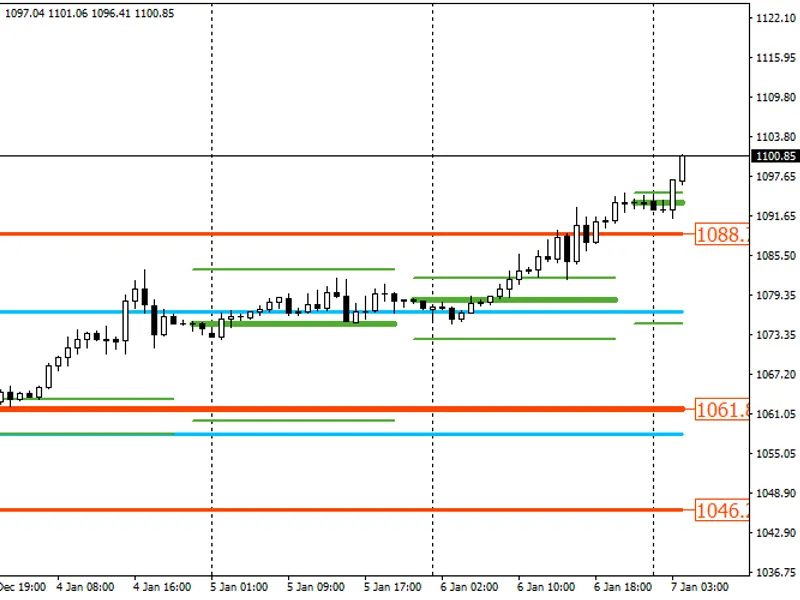
The following image shows High, Close and Low for: Previous day(Green), Previous week(Blue) and Previous month(Red). 3 instances of the indicator were attached to the chart and as you can see, only the month lines shows the value tag at the end of it(Probe settings). This template can be downloaded.