Dynamic Gaussian Channel
This is a powerful addition to your MetaTrader 5 toolkit designed to optimize market analysis and performance. This technical indicator acts as a specialized analysis tool designed to visualize market data. It helps traders identify emerging trends, momentum shifts, and key support or resistance levels by plotting statistical calculations directly onto price charts.
How to Setup and Use Dynamic Gaussian Channel
1. Installation: Place your file in the MQL/Indicators folder via "Open Data Folder" and restart your terminal.
2. Loading: Find the indicator in the Navigator, drag it onto your chart, and configure the input parameters in the popup window.
3. Customization: Press Ctrl+I to open the indicator list, select your tool, and click "Properties" to change colors, levels, or visual styles.
4. Updating: Replace the old file in the Indicators folder with the new version and restart the platform to apply changes.
Frequently Asked Questions
Q: Why is my indicator not showing? A: Verify the file is in the MQL/Indicators folder, or try right-clicking the "Indicators" tree in the Navigator and clicking "Refresh."
Q: Do custom indicators slow down the platform? A: Too many complex indicators can impact performance; remove unused ones via the "Indicator List" (Ctrl+I).
Q: Can I use MT4 indicators on MT5? A: No, MQL4 and MQL5 are distinct languages; ensure the indicator is compiled specifically for your platform version.
Description & Settings
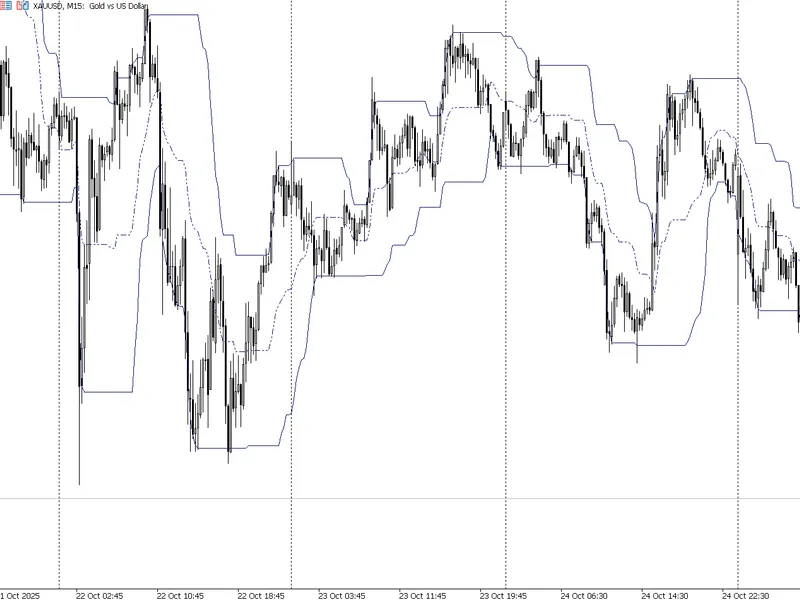
The indicator builds dynamic support and resistance levels based on smoothed price data using Gaussian filter.
Key features
Three lines
: resistance (DRAW_LINE), median (DRAW_LINE), support (DRAW_LINE).
Algorithm
:
Applies Gaussian smoothing to high/low prices
Finds extrema for the specified period
Builds a channel based on the smoothed values
Customisable parameters
:
Calculation period (InpPeriod)
Line colours and styles for each level
Working principle
Initialisation
: calculates Gaussian filter weights for smoothing
Smoothing
: applies the filter to high and low prices
Definition of levels
:
Resistance = maximum of smoothed high for the period
Support = minimum of smoothed low for the period
Median = average between support and resistance
Implementation Features
Uses indicator buffers for three levels
Gaussian filter with 5 bars window
Optimised recalculation of new bars only
Supports various timeframes
The indicator is useful for identifying dynamic support/resistance levels and defining price channels in the market.