MA Si Wave Hist
This professional-grade solution for MetaTrader 5 helps traders achieve greater efficiency in their daily workflow. This technical indicator acts as a specialized analysis tool designed to visualize market data. It helps traders identify emerging trends, momentum shifts, and key support or resistance levels by plotting statistical calculations directly onto price charts.
How to Setup and Use MA Si Wave Hist
1. Installation: Place your file in the MQL/Indicators folder via "Open Data Folder" and restart your terminal.
2. Loading: Find the indicator in the Navigator, drag it onto your chart, and configure the input parameters in the popup window.
3. Customization: Press Ctrl+I to open the indicator list, select your tool, and click "Properties" to change colors, levels, or visual styles.
4. Updating: Replace the old file in the Indicators folder with the new version and restart the platform to apply changes.
Frequently Asked Questions
Q: Why is my indicator not showing? A: Verify the file is in the MQL/Indicators folder, or try right-clicking the "Indicators" tree in the Navigator and clicking "Refresh."
Q: Do custom indicators slow down the platform? A: Too many complex indicators can impact performance; remove unused ones via the "Indicator List" (Ctrl+I).
Q: Can I use MT4 indicators on MT5? A: No, MQL4 and MQL5 are distinct languages; ensure the indicator is compiled specifically for your platform version.
Description & Settings
This is an implementation of the market cycle indicator described by Raghee Horner.
The indicator principle is simple:
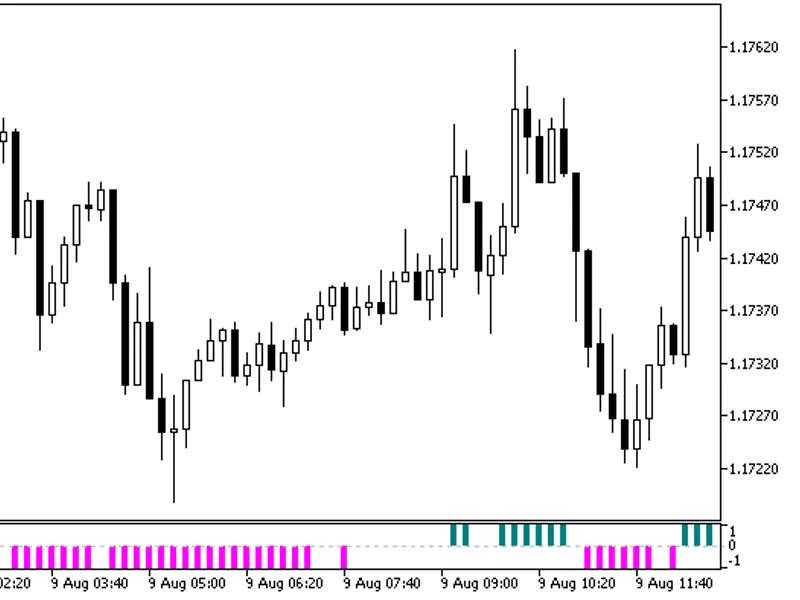
Green bars represent the presence of an uptrend, which appears when a bar closes above ЕМА 34 (High).
The absence of candles means consolidation, it appears when the bar closes within ЕМА 34 (High) and ЕМА 34 (Low).
Pink candlesticks represent the presence of a downtrend, which appears when a bar closes below ЕМА 34 (Low).
Signals are confirmed when three candles of the same color appear.
This indicator was first implemented in MQL4 and published in on 30.05.2017.
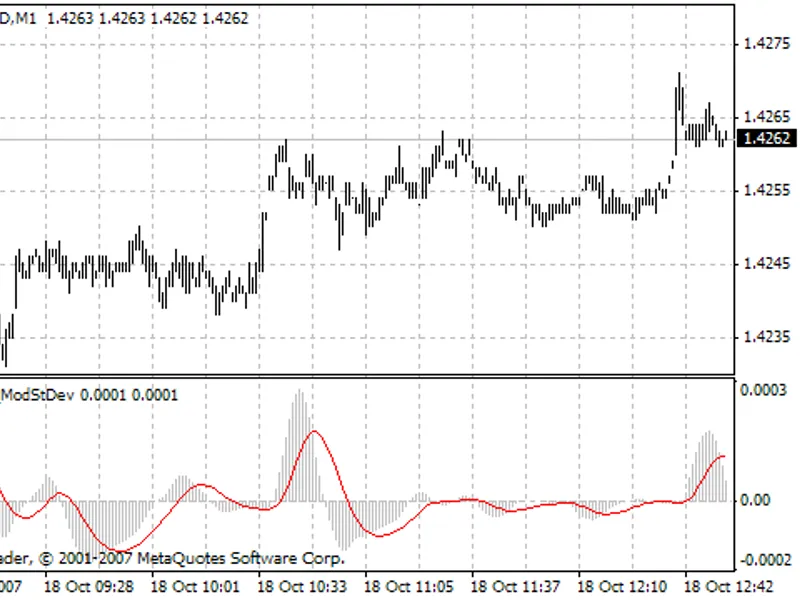
Fig. 1. The MASi_WaveHist indicator