








ma c d coloured histogram
Info
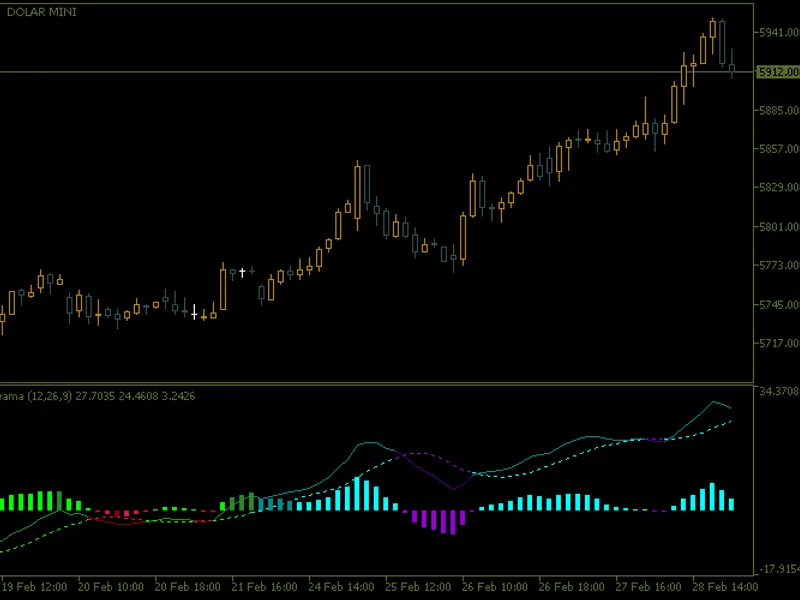
The ma c d coloured histogram is a Indicator for MetaTrader 5 that key featuresdynamic and coloured histogram: the histogram changes colour automatically based on market conditions, allowing you to view it at a glance:when the macd crosses above or below the signal line. when the macd crosses above or below the zero line.
Usage
This tool is typically used for enhancing chart analysis and decision making.
Platform
This Indicator works exclusively on MetaTrader 5 (both build 600+ and newer versions).
Setup
Place the downloaded file in MQL5/Indicators folder via File ? Open Data Folder in MetaTrader 5.
How to Install and Use ma c d coloured histogram
1. Installation: Place your file in the MQL/Indicators folder via "Open Data Folder" and restart your terminal.
2. Loading: Find the indicator in the Navigator, drag it onto your chart, and configure the input parameters in the popup window.
3. Customization: Press Ctrl+I to open the indicator list, select your tool, and click "Properties" to change colors, levels, or visual styles.
4. Updating: Replace the old file in the Indicators folder with the new version and restart the platform to apply changes.
Frequently Asked Questions
Q: Why is my indicator not showing? A: Verify the file is in the MQL/Indicators folder, or try right-clicking the "Indicators" tree in the Navigator and clicking "Refresh."
Q: Do custom indicators slow down the platform? A: Too many complex indicators can impact performance; remove unused ones via the "Indicator List" (Ctrl+I).
Q: Can I use MT4 indicators on MT5? A: No, MQL4 and MQL5 are distinct languages; ensure the indicator is compiled specifically for your platform version.
What this tool does
key featuresdynamic and coloured histogram: the histogram changes colour automatically based on market conditions, allowing you to view it at a glance:when the macd crosses above or below the signal line.
Typical Use Case
This Indicator excels in automated trading and technical analysis on MetaTrader 5.
Compatible Platform & Setup
This Indicator works on MetaTrader 5. Place the file in the MQL5/Indicators folder and restart the terminal.
Description & Settings
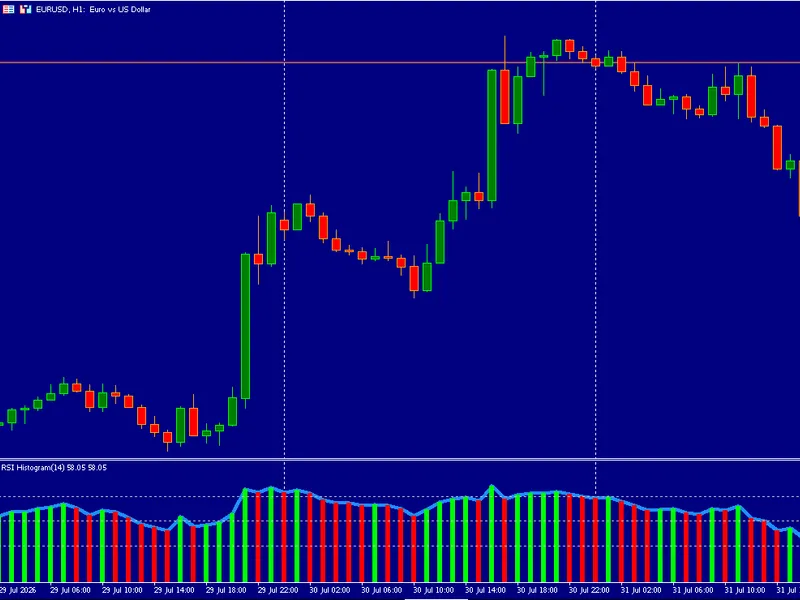
Related: RSI Histogram Indicator for MT5 - another powerful indicator for MetaTrader 5 traders.
key features
dynamic and coloured histogram:
the histogram changes colour automatically based on market conditions, allowing you to view it at a glance:
Also recommended: multi-timeframe macd histogram indicator (v03) - similar indicator with strong performance on MetaTrader 5.
when the macd crosses above or below the signal line.
when the macd crosses above or below the zero line.
the strength and direction of the trend.
customisable sound alerts:
receive real-time notifications whenever important crossings occur between the macd and the signal line or when the macd crosses the zero region. you can configure
the sound of the alert.
the maximum number of repetitions.
the minimum pause between alerts.
configurable colours:
the indicator uses a rich and intuitive colour palette to highlight different states of the macd, signal line and histogram. the colours are easy to interpret and help in making quick decisions.
customisable parameters
:
periods of the fast and slow moving averages.
period of the signal moving average.
price applied to the calculation (close, open, maximum, minimum, etc.).
user-friendly interface:
the indicator is easy to set up and use, even for beginner traders. all parameters can be adjusted directly in the properties window.
how it works
:
the indicator calculates the difference between the macd and its signal line, displaying the result as a coloured histogram.
different colours are used to represent crossovers, positive/negative trends and changes in momentum.
audible alerts are triggered when important events occur, such as line crossings or transitions between positive and negative regions.
benefits
:
quick decision making:
with dynamic colours and sound alerts, you can react quickly to changes in the market.
full customisation:
adjust the parameters to suit your trading strategy.
clear visualisation:
the clean and intuitive design makes it easy to interpret the data, even on busy charts.
compatibility:
works perfectly on any asset and timeframe supported by metatrader 5.
examples of use
:
use the indicator to identify entry and exit points in trend strategies.
combine the
macd colour histogram
with other indicators to confirm buy/sell signals.
monitor the histogram to detect divergences between price and momentum.
You may also like: macd histogram indicator (multi-color) - excellent alternative for indicator users on MetaTrader 5.
Source Code
/.......
⚠ Limitations & Risk Warning
- This tool is provided for educational and testing purposes only.
- Past performance does not guarantee future results.
- Trading involves substantial risk of loss. Use on a demo account first.
- Results may vary depending on market conditions, broker, and settings.
- We recommend thorough backtesting and forward testing before using with real funds.