Line Break On Chart
This tool for MetaTrader 5 is specifically engineered to streamline your trading operations. This technical indicator acts as a specialized analysis tool designed to visualize market data. It helps traders identify emerging trends, momentum shifts, and key support or resistance levels by plotting statistical calculations directly onto price charts.
How to Setup and Use Line Break On Chart
1. Installation: Place your file in the MQL/Indicators folder via "Open Data Folder" and restart your terminal.
2. Loading: Find the indicator in the Navigator, drag it onto your chart, and configure the input parameters in the popup window.
3. Customization: Press Ctrl+I to open the indicator list, select your tool, and click "Properties" to change colors, levels, or visual styles.
4. Updating: Replace the old file in the Indicators folder with the new version and restart the platform to apply changes.
Frequently Asked Questions
Q: Why is my indicator not showing? A: Verify the file is in the MQL/Indicators folder, or try right-clicking the "Indicators" tree in the Navigator and clicking "Refresh."
Q: Do custom indicators slow down the platform? A: Too many complex indicators can impact performance; remove unused ones via the "Indicator List" (Ctrl+I).
Q: Can I use MT4 indicators on MT5? A: No, MQL4 and MQL5 are distinct languages; ensure the indicator is compiled specifically for your platform version.
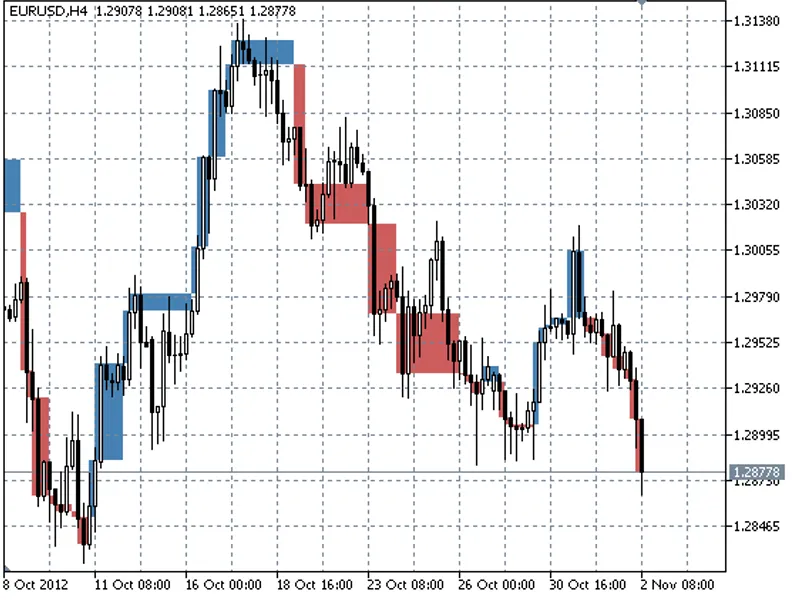
Description & Settings
It is written by Steve Nison book "Beyond Candlesticks". Despite of the standard charts of the linear reversal it is drawn not on the separate but the main window over the current pair of the chart and considering timeframe. Besides, the extra parameter of the minimum size of the box (not considering reversal boxes) is added that makes this indicator similar but not identical to renko-charts.
Since the boxes are drawn without using the indicator buffers, but are objects, in order not to overload the terminal the parameter of starting date for calculation of the indicator is added (the minimum date is 2001.01.01).
Another detail is the added SeriesBuffer indicator buffer that holds the number of boxes on each bar in order to receive the given value in the Expert Advisors. When up trend the buffer value will be positive, when down trend it will be negative.
Number of reversal lines = 3, the minimum box size = 0.
2. Number of reversal lines = 2, the minimum box size = 200 (pips).
Recommendations:
When using on М1 do not set the starting date for calculations to too early (optimum is a few months), when using on Н1 and higher timeframes, you can set the starting date for calculations to the minimum date value of the this indicator, i.e. start from 2001.