Baseline: i MA + AT R Bands
This professional-grade solution for MetaTrader 5 helps traders achieve greater efficiency in their daily workflow. This technical indicator acts as a specialized analysis tool designed to visualize market data. It helps traders identify emerging trends, momentum shifts, and key support or resistance levels by plotting statistical calculations directly onto price charts.
How to Setup and Use Baseline: i MA + AT R Bands
1. Installation: Place your file in the MQL/Indicators folder via "Open Data Folder" and restart your terminal.
2. Loading: Find the indicator in the Navigator, drag it onto your chart, and configure the input parameters in the popup window.
3. Customization: Press Ctrl+I to open the indicator list, select your tool, and click "Properties" to change colors, levels, or visual styles.
4. Updating: Replace the old file in the Indicators folder with the new version and restart the platform to apply changes.
Frequently Asked Questions
Q: Why is my indicator not showing? A: Verify the file is in the MQL/Indicators folder, or try right-clicking the "Indicators" tree in the Navigator and clicking "Refresh."
Q: Do custom indicators slow down the platform? A: Too many complex indicators can impact performance; remove unused ones via the "Indicator List" (Ctrl+I).
Q: Can I use MT4 indicators on MT5? A: No, MQL4 and MQL5 are distinct languages; ensure the indicator is compiled specifically for your platform version.
Description & Settings
Indicator Name
: Baseline: iMA + ATR Bands
Description
:Baseline: iMA+ATR Bands is a custom indicator that combines a standard Moving Average (MA) with upper and lower bands based on the Average True Range (ATR). The result is a simple yet powerful visual tool for identifying market trends, potential breakouts, and volatility.
Background
:This indicator was inspired by the
No Nonsense Forex (NNFX)
trading methodology, where the Baseline acts as a primary trend filter. I developed this to make the baseline setup easier to read and interpret directly on the chart.
How to use :
iMA Period – The number of bars used to calculate the Moving Average.
iMA Method – Type of Moving Average (SMA, EMA, SMMA, LWMA).
Applied Price – Source price for MA (e.g., Close, Open, High, Low).
ATR Period – Number of bars used for ATR calculation.
ATR Multiplier – The factor applied to the ATR value to calculate the upper and lower bands.
Trading Suggestions (not financial advice) :
Use the MA line as your baseline trend filter.
Price crossing above the upper band may suggest bullish momentum.
Price crossing below the lower band may indicate bearish momentum.
Combine with confirmation, volume, and exit indicators in line with your strategy (e.g., NNFX guidelines).
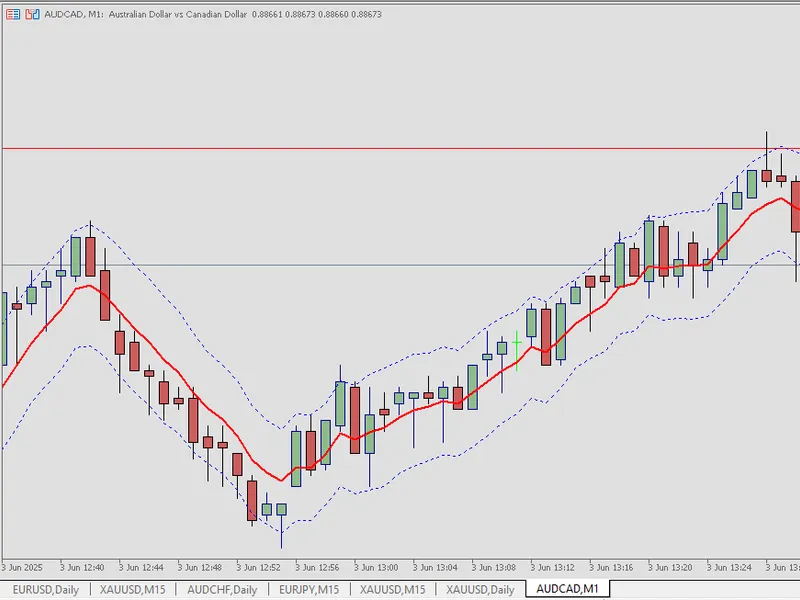
Screenshots :
Input Settings :
Color & Lines Settings :
About :