Investor Preference Index
This professional-grade solution for MetaTrader 5 helps traders achieve greater efficiency in their daily workflow. This technical indicator acts as a specialized analysis tool designed to visualize market data. It helps traders identify emerging trends, momentum shifts, and key support or resistance levels by plotting statistical calculations directly onto price charts.
How to Setup and Use Investor Preference Index
1. Installation: Place your file in the MQL/Indicators folder via "Open Data Folder" and restart your terminal.
2. Loading: Find the indicator in the Navigator, drag it onto your chart, and configure the input parameters in the popup window.
3. Customization: Press Ctrl+I to open the indicator list, select your tool, and click "Properties" to change colors, levels, or visual styles.
4. Updating: Replace the old file in the Indicators folder with the new version and restart the platform to apply changes.
Frequently Asked Questions
Q: Why is my indicator not showing? A: Verify the file is in the MQL/Indicators folder, or try right-clicking the "Indicators" tree in the Navigator and clicking "Refresh."
Q: Do custom indicators slow down the platform? A: Too many complex indicators can impact performance; remove unused ones via the "Indicator List" (Ctrl+I).
Q: Can I use MT4 indicators on MT5? A: No, MQL4 and MQL5 are distinct languages; ensure the indicator is compiled specifically for your platform version.
Description & Settings
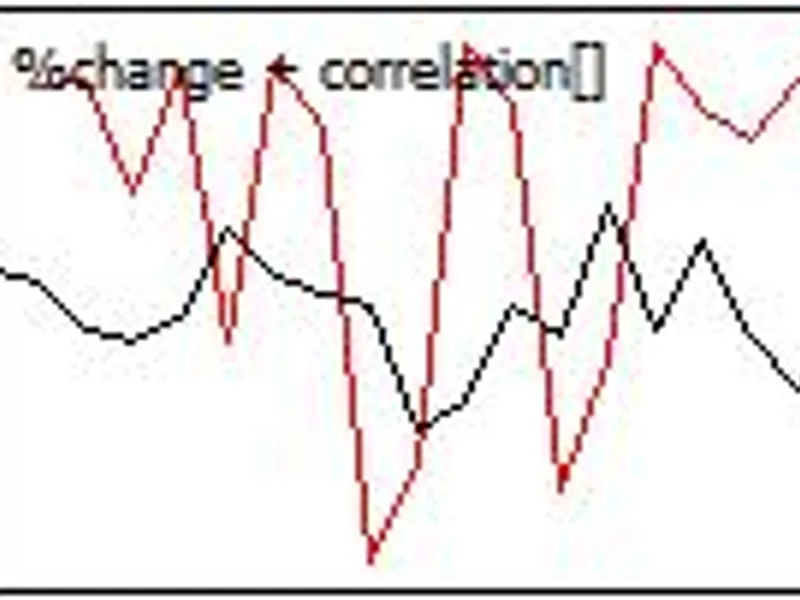
Investor Preference Index was discussed in the "Technical Analysis of Stocks & Commodities" magazine in December, 1997, page 19. The article was written by Cyril V. Smith Jr.Initially, this indicator, which was used as the long-term stock market investment tool, compared the efficiency of S&P 500 with the New York Stock Exchange to measure sentiment. The theory suggests that investors prefer certain types of investment.
The indicator has five input parameters:
Instrument
- the name of the financial instrument
ROC period
- period for calculating the price rate of change
Fast smoothing period
- the period of the fast smoothing
Slow smoothing period
- the period of the slow smoothing
Result smoothing period
- the period of the resulting smoothing
Calculation:
where:
Please note that in order for the indicator to display correctly, historical data for the 'Instrument' symbol are needed, which can lead to a delay in displaying the oscillator line during the first launch or symbol changed.
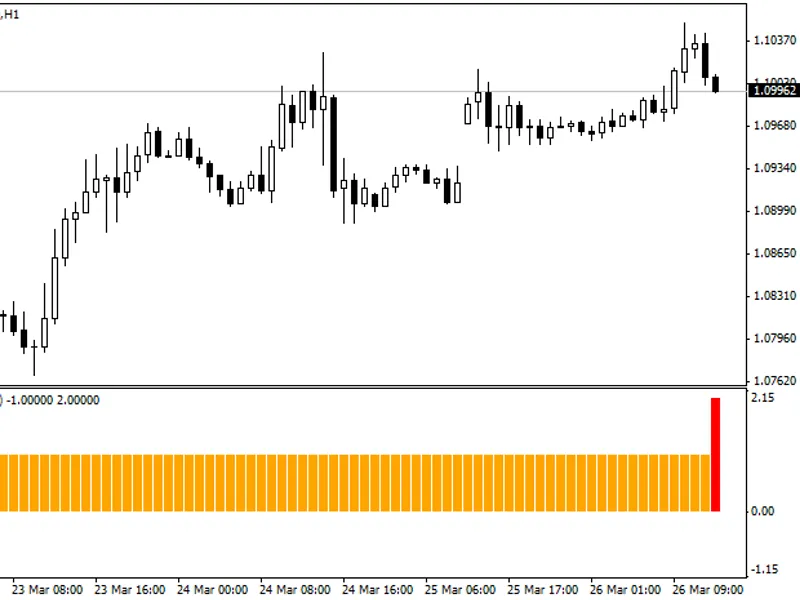
Fig. 1. Investor Preference Index GBPUSD relative to EURUSD
Fig. 2. Investor Preference Index GBPUSD relative to USDJPY
Fig. 3. Investor Preference Index GBPUSD relative to AUDCAD
Fig. 4. Investor Preference Index GBPUSD relative to USDRUB