id digits object
This tool for MetaTrader 5 is specifically engineered to streamline your trading operations. This technical indicator acts as a specialized analysis tool designed to visualize market data. It helps traders identify emerging trends, momentum shifts, and key support or resistance levels by plotting statistical calculations directly onto price charts.
How to Setup and Use id digits object
1. Installation: Place your file in the MQL/Indicators folder via "Open Data Folder" and restart your terminal.
2. Loading: Find the indicator in the Navigator, drag it onto your chart, and configure the input parameters in the popup window.
3. Customization: Press Ctrl+I to open the indicator list, select your tool, and click "Properties" to change colors, levels, or visual styles.
4. Updating: Replace the old file in the Indicators folder with the new version and restart the platform to apply changes.
Frequently Asked Questions
Q: Why is my indicator not showing? A: Verify the file is in the MQL/Indicators folder, or try right-clicking the "Indicators" tree in the Navigator and clicking "Refresh."
Q: Do custom indicators slow down the platform? A: Too many complex indicators can impact performance; remove unused ones via the "Indicator List" (Ctrl+I).
Q: Can I use MT4 indicators on MT5? A: No, MQL4 and MQL5 are distinct languages; ensure the indicator is compiled specifically for your platform version.
Description & Settings
Clicking on any graphical object makes this indicator display these kinds of information in the Experts tab of the terminal:
name and type of the clicked object;
date and values of its anchor points;
the number of decimal places (the number of digits in the fractional part) in these anchor point values.
It works with graphical objects in the main window and its subwindows.
It can help identify non-normalized anchor point values by displaying the number of decimal places in them. The function for calculation of decimal place number can be used separately for any other purpose in any other programs.
This indicator works with graphical objects listed below:
Often indicators set in a chart's subwindows have values that differ from the chart's main window by the number of decimal places. This auxiliary program makes it possible to verify the decimal place number of values of the anchor points of the graphical objects (set in the subwindows of the indicators). Regardless of the decimal place number set in the main window:
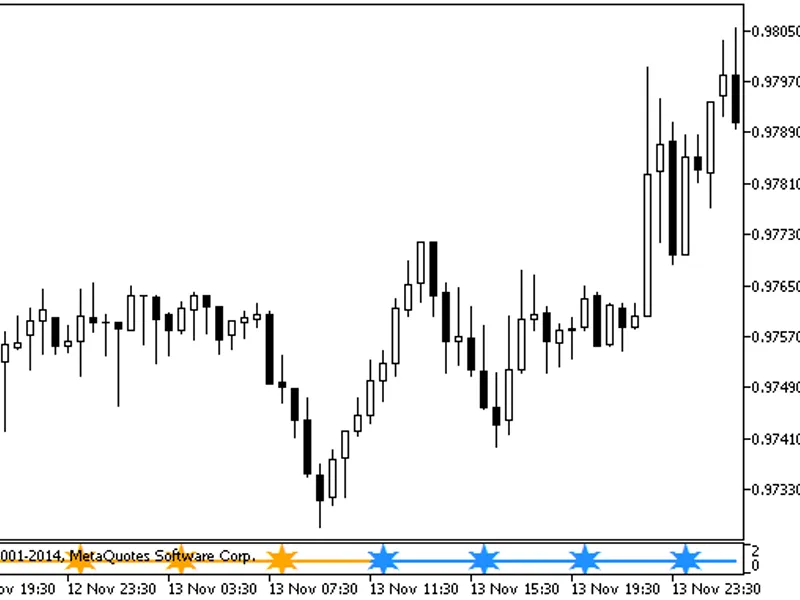
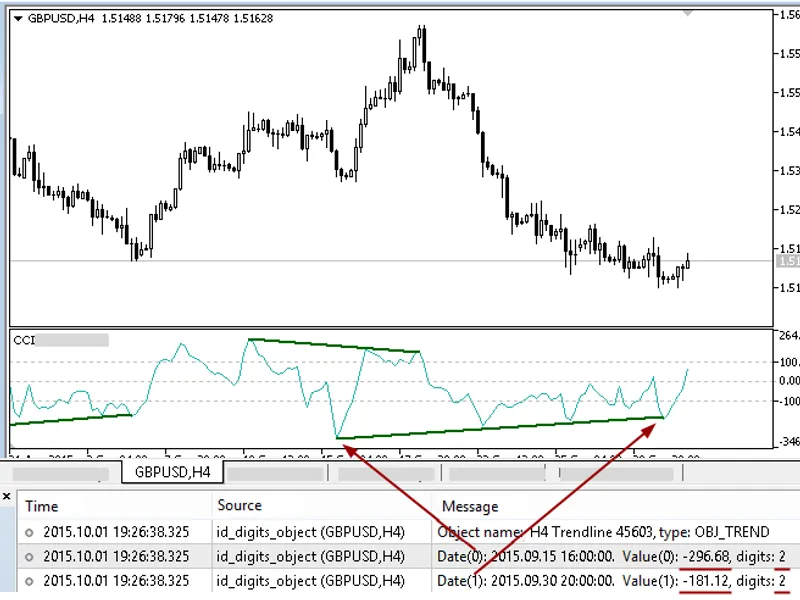
Fig. 1. indicator's subwindow with two-digit values on a chart with five-digit quotes. The trend line in the
CCI
subwindow with two-digit values
Fig. 2. indicator subwindow with six-digit values on a chart with five-digit quotes. The trend line in
MACD
subwindow with six-digit values
Fig. 3. Elliott Motive Wave anchor point values in a chart's main window.
Seemingly strange differences can be encountered during the application of the
id_digits_objects
indicator. For example, in the
fig. 4
below a line with five digits is clearly visible on a five-digit quotes chart, the properties of this line also show five digits, but the indicator "boldly" displays eight:
Fig. 4.
id_digits_object
has found a non-normalized value at a horizontal line
If this happens on a click on a programmatically set graphical object, then, if necessary, check the usage of the value normalizaton at the time the objects are set in the code of the program, which created the object. If the object was set on the chart manually, then, if necessary, its values can be edited manually in the following way:
in the "Settings" tab of the properties dialog of such an object, click on its anchor point value (if it has several acnhor point values, it is sufficient to click on the top one, for instance);
close the properties dialog box of the object by pressing the "Ok" button.
After that click on the object again to make sure the values are normalized with the help of
id_digits_object
. Figures 5 and 6 demonstrate visual oreder of the described steps:
Fig. 5. Normalization of a manually set object via its properties dialog box
Fig. 6. The same horizontal line, but with a normalized value
However, if necessary, to normalize the anchor point values of the manually set objects programmatic ways can be used. For example, there is a ready-made indicator for trend lines, horizontal lines and Fibonacci levels: , which not only helps normalize graphical object values, but also round them up to the required decimal point if needed.