ID Compare HH LL and delta base
This professional-grade solution for MetaTrader 5 helps traders achieve greater efficiency in their daily workflow. This technical indicator acts as a specialized analysis tool designed to visualize market data. It helps traders identify emerging trends, momentum shifts, and key support or resistance levels by plotting statistical calculations directly onto price charts.
How to Setup and Use ID Compare HH LL and delta base
1. Installation: Place your file in the MQL/Indicators folder via "Open Data Folder" and restart your terminal.
2. Loading: Find the indicator in the Navigator, drag it onto your chart, and configure the input parameters in the popup window.
3. Customization: Press Ctrl+I to open the indicator list, select your tool, and click "Properties" to change colors, levels, or visual styles.
4. Updating: Replace the old file in the Indicators folder with the new version and restart the platform to apply changes.
Frequently Asked Questions
Q: Why is my indicator not showing? A: Verify the file is in the MQL/Indicators folder, or try right-clicking the "Indicators" tree in the Navigator and clicking "Refresh."
Q: Do custom indicators slow down the platform? A: Too many complex indicators can impact performance; remove unused ones via the "Indicator List" (Ctrl+I).
Q: Can I use MT4 indicators on MT5? A: No, MQL4 and MQL5 are distinct languages; ensure the indicator is compiled specifically for your platform version.
Description & Settings
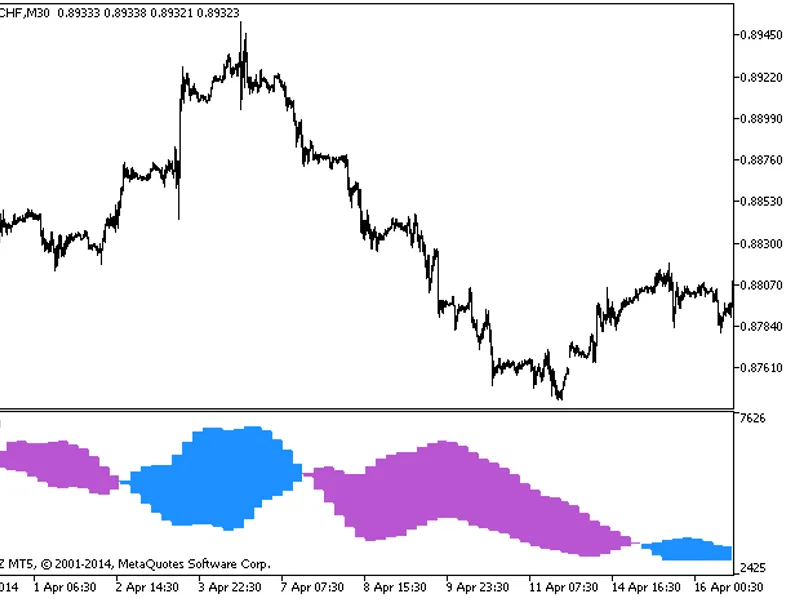
This oscillator shows in form of a histogram the differences in points between the successive:
High of bars/candlesticks;
Low of bars/candlesticks.
It also shows them in different colors, depending on:
High and Low directions;
amount of points set in the properties. Features of histogram columns
above the zero line shown in the separate window of this indicator are the differences between
High[n]
and
High[n-1]
;
below the zero line are the differences between
Low[n]
and
Low[n-1]
;
showing in different colors depending on the High and Low directions and on the sizes in points:
For (
High[n] < High[n-1]
), as well as for (
Low[n] < Low[n-1]
):
If the difference in points is greater than that set in the indicator properties, the default color =
DarkSlateGray
;
If it is lower than that set in the properties, then the color =
DeepPink
.
For (
High[n] > High[n-1]
), as well as for (
Low[n] > Low[n-1]
):
If the absolute difference in points is greater than that set in the indicator properties, then the default color =
LightGreen
;
If it is lower than that set in the properties, then the color =
Gold
.
Histogram is plotted starting from the first bar following the zeroth bar. Input parameters
i_delta_base
- difference in points, for the values below which the following display colors are set by default:
DeepPink
and
Gold
;
i_bars
- the number of the last bars, for which the indicator values will be shown.