i-Spectr Analysis RV I
This tool for MetaTrader 5 is specifically engineered to streamline your trading operations. This technical indicator acts as a specialized analysis tool designed to visualize market data. It helps traders identify emerging trends, momentum shifts, and key support or resistance levels by plotting statistical calculations directly onto price charts.
How to Setup and Use i-Spectr Analysis RV I
1. Installation: Place your file in the MQL/Indicators folder via "Open Data Folder" and restart your terminal.
2. Loading: Find the indicator in the Navigator, drag it onto your chart, and configure the input parameters in the popup window.
3. Customization: Press Ctrl+I to open the indicator list, select your tool, and click "Properties" to change colors, levels, or visual styles.
4. Updating: Replace the old file in the Indicators folder with the new version and restart the platform to apply changes.
Frequently Asked Questions
Q: Why is my indicator not showing? A: Verify the file is in the MQL/Indicators folder, or try right-clicking the "Indicators" tree in the Navigator and clicking "Refresh."
Q: Do custom indicators slow down the platform? A: Too many complex indicators can impact performance; remove unused ones via the "Indicator List" (Ctrl+I).
Q: Can I use MT4 indicators on MT5? A: No, MQL4 and MQL5 are distinct languages; ensure the indicator is compiled specifically for your platform version.
Description & Settings
klot
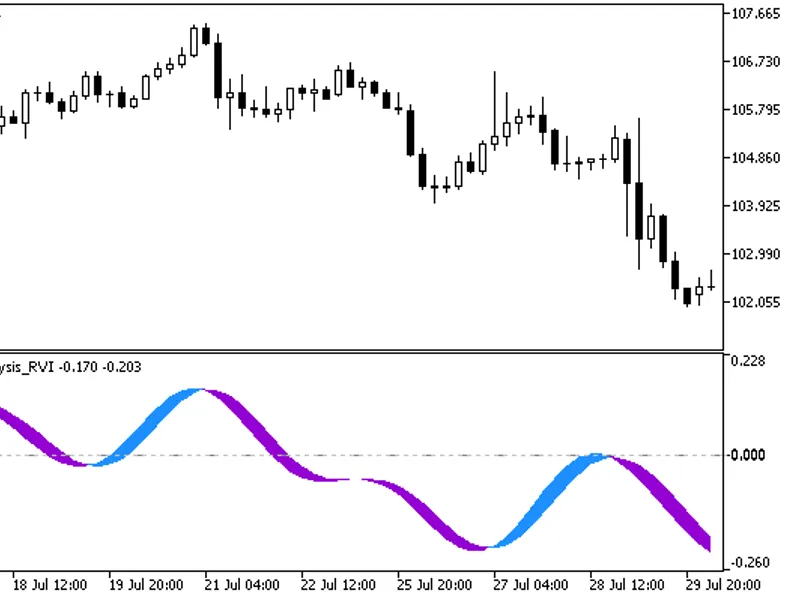
The indicator is an example of smoothing a time series of the RVI indicator by filtering harmonics of higher order.
This approach can be applied to smooth the values of any indicators. The main advantage of the method is virtually no delay.
Indicator input parameters:
where:
N — series length (power of two);
SS — Smoothing coefficient, zeroes the frequencies above the specified value in the obtained spectrum. SS cannot be greater than 2^N. If SS = 2^N, the RVI series is fully repeated.
The indicator operation requires the library: .
Fig.1. The i-SpectrAnalysis_RVI indicator