i GD R Fractal Levels
This is a powerful addition to your MetaTrader 5 toolkit designed to optimize market analysis and performance. This technical indicator acts as a specialized analysis tool designed to visualize market data. It helps traders identify emerging trends, momentum shifts, and key support or resistance levels by plotting statistical calculations directly onto price charts.
How to Setup and Use i GD R Fractal Levels
1. Installation: Place your file in the MQL/Indicators folder via "Open Data Folder" and restart your terminal.
2. Loading: Find the indicator in the Navigator, drag it onto your chart, and configure the input parameters in the popup window.
3. Customization: Press Ctrl+I to open the indicator list, select your tool, and click "Properties" to change colors, levels, or visual styles.
4. Updating: Replace the old file in the Indicators folder with the new version and restart the platform to apply changes.
Frequently Asked Questions
Q: Why is my indicator not showing? A: Verify the file is in the MQL/Indicators folder, or try right-clicking the "Indicators" tree in the Navigator and clicking "Refresh."
Q: Do custom indicators slow down the platform? A: Too many complex indicators can impact performance; remove unused ones via the "Indicator List" (Ctrl+I).
Q: Can I use MT4 indicators on MT5? A: No, MQL4 and MQL5 are distinct languages; ensure the indicator is compiled specifically for your platform version.
Description & Settings
GreenDog
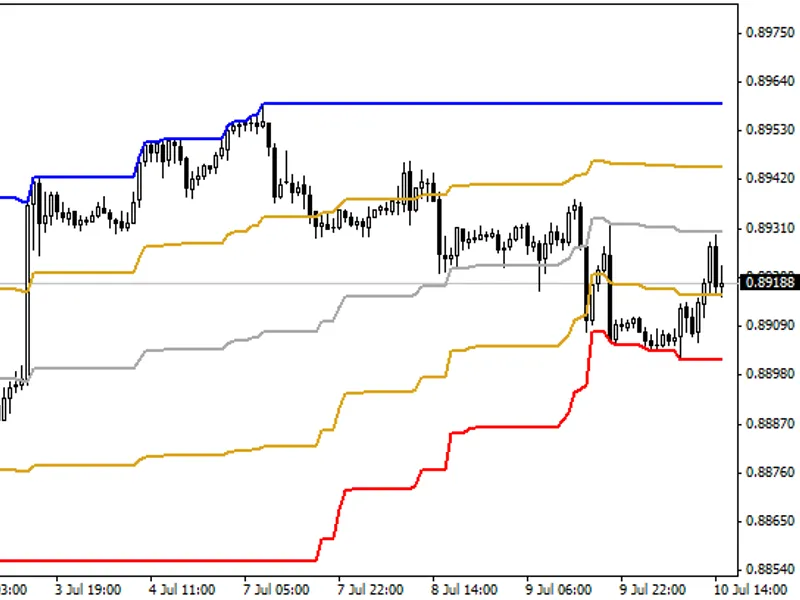
iGDR_Fractal_Levels indicator shows the fractals average values over a certain period of time. The indicator displays only three levels on the chart showing them in different colors. The same levels are plotted to the right from the text labels, though considering the variation used for calculation of an average value.
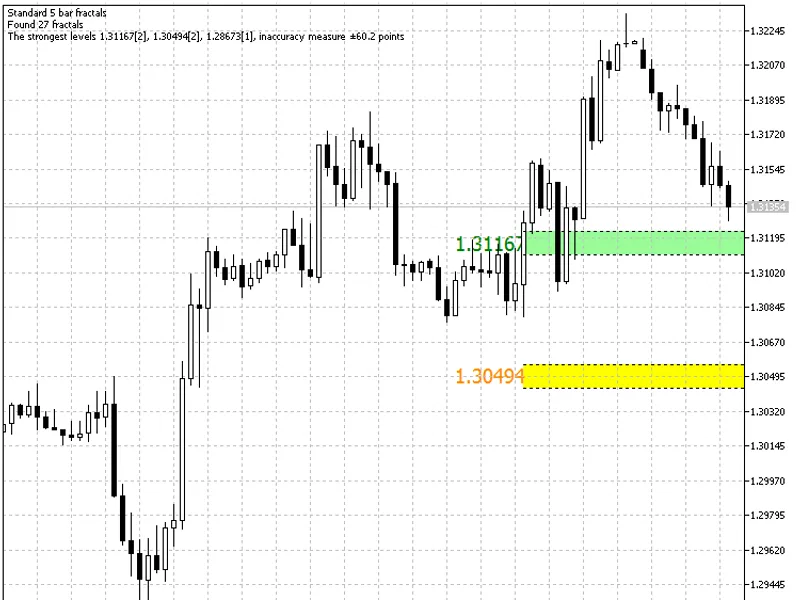
The indicator works as follows. The chart time interval from the end to the beginning is selected but a strictly limited number of bars specified in the indicator parameters is taken at the same time. Searching for fractals is carried out at this interval. Three price levels with the highest number of fractals are calculated afterwards and the price of each fractal is determined. Then the average price is found among determined ones. This average price is then displayed by the indicator, while a spread of prices of other fractals enlarges the line size, as this spread is the most powerful level.
Only three price levels are formed from all fractal ones by the indicator. Each of the three has its own color depending on the number of fractals included in building of this level. The strongest level is red, the middle one is yellow, while the weakest one is painted in green, though it also must be considered in trading activity.
Usage in trading:
As with all other levels in the Forex market, these levels have no specific differences, but we must always bear in mind that deals with the use of fractals are opened only in the direction of these fractals breakout. The same thing with the levels. We must enter the market in the direction of these levels breakout, as that is the strongest signal for market entry, while nearby levels can be used as initial stop levels and profit targets.