




Hull Moving Average with Slope Color Change
Info
The Hull Moving Average with Slope Color Change is a Indicator for MetaTrader 5 that hull moving average with slope color change the idea behind it ordinary moving averages are smooth but late. Alan Hull designed his moving average to reduce that lag without giving up the smoothness.
Usage
This tool is typically used for enhancing chart analysis and decision making.
Platform
This Indicator works exclusively on MetaTrader 5 (both build 600+ and newer versions).
Setup
Place the downloaded file in MQL5/Indicators folder via File ? Open Data Folder in MetaTrader 5.
How to Install and Use Hull Moving Average with Slope Color Change
1. Installation: Place your file in the MQL/Indicators folder via "Open Data Folder" and restart your terminal.
2. Loading: Find the indicator in the Navigator, drag it onto your chart, and configure the input parameters in the popup window.
3. Customization: Press Ctrl+I to open the indicator list, select your tool, and click "Properties" to change colors, levels, or visual styles.
4. Updating: Replace the old file in the Indicators folder with the new version and restart the platform to apply changes.
Frequently Asked Questions
Q: Why is my indicator not showing? A: Verify the file is in the MQL/Indicators folder, or try right-clicking the "Indicators" tree in the Navigator and clicking "Refresh."
Q: Do custom indicators slow down the platform? A: Too many complex indicators can impact performance; remove unused ones via the "Indicator List" (Ctrl+I).
Q: Can I use MT4 indicators on MT5? A: No, MQL4 and MQL5 are distinct languages; ensure the indicator is compiled specifically for your platform version.
What this tool does
Hull Moving Average with Slope Color Change The idea behind it Ordinary moving averages are smooth but late.
Typical Use Case
This Indicator excels in automated trading and technical analysis on MetaTrader 5.
Compatible Platform & Setup
This Indicator works on MetaTrader 5. Place the file in the MQL5/Indicators folder and restart the terminal.
Description & Settings
Related: Kaufman Adaptive Moving Average (KAMA) Ribbon - another powerful indicator for MetaTrader 5 traders.
Hull Moving Average with Slope Color Change
Also recommended: Confirmed Swing Pivots with Trend Moving Average - similar indicator with strong performance on MetaTrader 5.
The idea behind it
Ordinary moving averages are smooth but late. Alan Hull designed his moving average to reduce that lag without giving up the smoothness. It is built from weighted moving averages (WMA) in three steps:
Calculate a WMA of the price over n/2 bars (fast) and a WMA over n bars (slow).
Take twice the fast one minus the slow one. This overshoots in the direction of the move and removes most of the lag.
Smooth the result with a WMA over sqrt(n) bars to remove the noise that step 2 adds.
HMA = WMA(2 × WMA(price, n/2) − WMA(price, n), sqrt(n))
Because the Hull line turns early, the most useful information it gives is its direction. This indicator makes the direction visible at a glance: the line is drawn in one color while its slope is positive and in another while it is negative, so there is no need to compare values by eye. Optional arrows mark the bar where the slope changes from not-up to up, or from not-down to down.
The calculation is incremental: the applied price and the intermediate series are stored in buffers, and after the first pass only the last bar and new bars are recalculated on each tick.
How to interpret it
Thick colored line (HMA)
: the Hull Moving Average. The color of each segment shows the slope on that bar: the "up" color when the HMA rose by more than the minimum slope, the "down" color when it fell by more than the minimum slope, and the neutral color when the change was smaller than the minimum.
Up arrow below the bar
: the HMA slope has just turned up.
Down arrow above the bar
: the HMA slope has just turned down.
Text label
in the lower left corner of the chart: the slope state of the last closed bar (UP, DOWN or FLAT) and the change of the HMA per bar in points.
A long run of one color is a steady trend; frequent color changes mean a range or an HMA period that is too short for the timeframe.
The first bars of the history are left empty: the HMA needs n + round(sqrt(n)) − 2 bars to start, and one more bar to get a direction.
Arrows are drawn on closed bars by default, so they do not appear and disappear while a bar is forming. The line color of the live bar can still change until the bar closes.
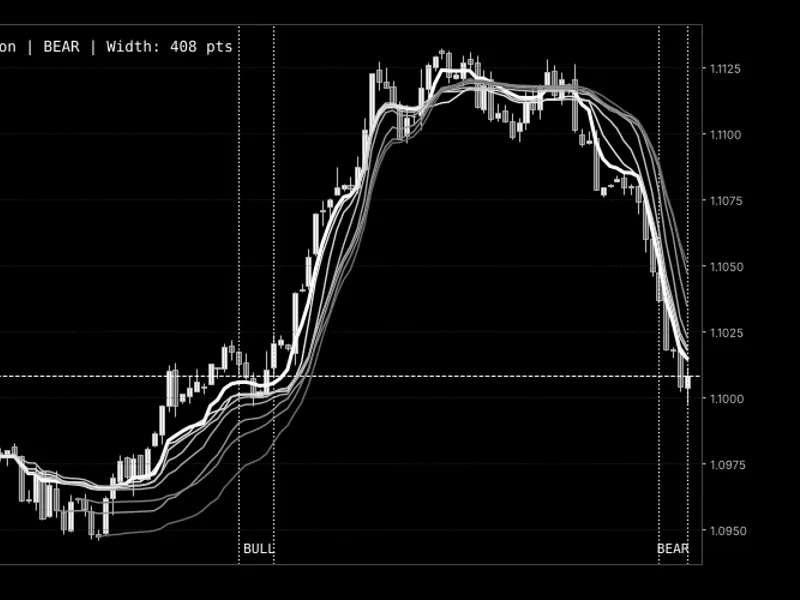
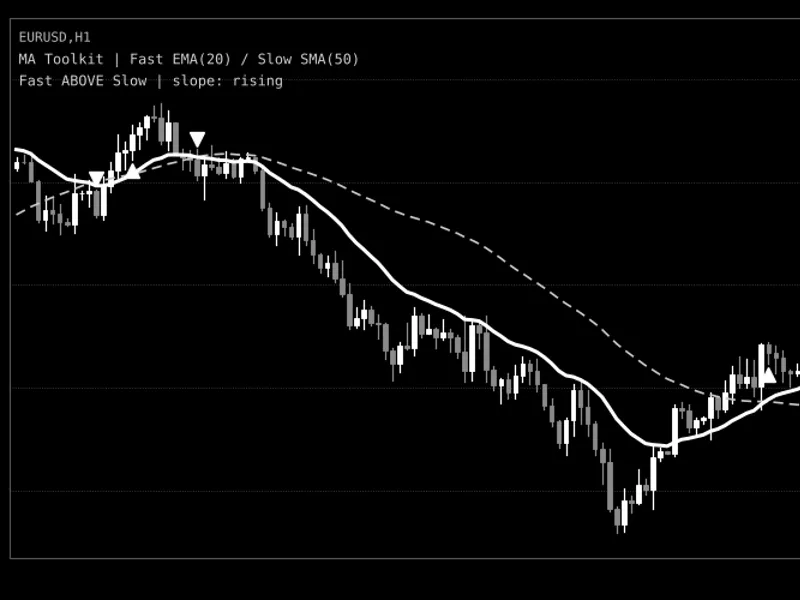
Fig. 1. HMA(21) on an EURUSD H1 chart with the turn arrows and the slope label. The image is black & white according to the Code Base image guidelines: a rising HMA is shown as a solid line and a falling HMA as a dashed line; on a real chart these are the configurable up and down colors.
External variables (inputs)
Input
Default
Purpose
Hull moving average
InpPeriod
21
HMA period n. The fast WMA uses n/2 bars (integer division) and the final smoothing uses round(sqrt(n)) bars. Must be at least 2.
InpPrice
PRICE_CLOSE
Applied price: close, open, high, low, median, typical or weighted.
Slope
InpMinSlopePoints
0.0
Minimum change of the HMA per bar, in points, for the slope to count as up or down. Smaller changes are treated as flat. With 0.0 any change colors the line. Must not be negative.
Colors and signals
InpColorUp
clrDodgerBlue
Line and arrow color for an upward slope.
InpColorDown
clrRed
Line and arrow color for a downward slope.
InpColorFlat
clrGray
Line color when the slope is below the minimum.
InpShowArrows
true
Shows arrows where the slope turns up or down.
InpClosedBarsOnly
true
Draws arrows only on closed bars, so that an arrow never appears and disappears on the live bar.
InpShowLabel
true
Shows the text label with the slope state of the last closed bar.
InpLabelColor
clrGray
Color of the text label.
Recommended use
Symbols and timeframes.
It works on any symbol and timeframe, since it only uses prices. Shorter periods (9 to 21) suit M5 to H1; longer ones (34 to 55) suit H4 and D1.
Trend filter.
The slope color works well as a direction filter: for example, look for long entries only while the line has the up color, and for short entries only while it has the down color.
Flat market.
In a range the HMA changes direction often. Set InpMinSlopePoints to a value that is typical for the noise of your symbol, so that small wiggles are shown with the neutral color instead of as reversals. The unit is points, so the useful value depends on the symbol and its number of digits.
Repainting.
Like every moving average, the value of the live bar changes until it closes. With InpClosedBarsOnly enabled, arrows are never drawn on the live bar, so closed-bar signals do not repaint. Since the HMA is built from weighted averages of the whole window, the values of earlier bars do not change once they are closed.
Lag.
The HMA is faster than an SMA or EMA of the same period, but it is still based on past prices, and it can overshoot near sharp reversals. The arrow appears when the slope has already turned; it is not a prediction.
Chart objects.
The indicator creates one text label (when InpShowLabel is enabled) and deletes it when the indicator is removed or reloaded.
Account types.
It is a visual indicator: it does not trade, does not need DLLs and works the same on netting and hedging accounts.
The indicator is an analysis aid and is not a trading signal by itself. Combine it with your own entry rules and risk management.
You may also like: MA Toolkit: A Comprehensive Moving Average Indicator - excellent alternative for indicator users on MetaTrader 5.
Source Code
#property copyright "RobotFX"
#property link "https://robotfx.org"
#property version   "1.00"
#property description "This code is educational. Feel free to use, modify and upgrade as you wish. Visit ROBOTFX.ORG for professional trading tools"
#property indicator_chart_window
#property indicator_buffers 7
#property indicator_plots   3
#property indicator_label1  "HMA"
#property indicator_type1   DRAW_COLOR_LINE
#property indicator_color1  clrGray,clrDodgerBlue,clrRed
.......
⚠ Limitations & Risk Warning
- This tool is provided for educational and testing purposes only.
- Past performance does not guarantee future results.
- Trading involves substantial risk of loss. Use on a demo account first.
- Results may vary depending on market conditions, broker, and settings.
- We recommend thorough backtesting and forward testing before using with real funds.