






Kaufman Adaptive Moving Average (KAMA) Ribbon
Info
The Kaufman Adaptive Moving Average (KAMA) Ribbon is a Indicator for MetaTrader 5 that kama ribbon the idea behind it perry kaufman's adaptive moving average (kama) changes its own speed depending on market conditions. It measures the Efficiency Ratio (ER): the net price change over N bars divided by the sum of all bar-to-bar changes over the same N bars.
Usage
This tool is typically used for enhancing chart analysis and decision making.
Platform
This Indicator works exclusively on MetaTrader 5 (both build 600+ and newer versions).
Setup
Place the downloaded file in MQL5/Indicators folder via File ? Open Data Folder in MetaTrader 5.
How to Install and Use Kaufman Adaptive Moving Average (KAMA) Ribbon
1. Installation: Place your file in the MQL/Indicators folder via "Open Data Folder" and restart your terminal.
2. Loading: Find the indicator in the Navigator, drag it onto your chart, and configure the input parameters in the popup window.
3. Customization: Press Ctrl+I to open the indicator list, select your tool, and click "Properties" to change colors, levels, or visual styles.
4. Updating: Replace the old file in the Indicators folder with the new version and restart the platform to apply changes.
Frequently Asked Questions
Q: Why is my indicator not showing? A: Verify the file is in the MQL/Indicators folder, or try right-clicking the "Indicators" tree in the Navigator and clicking "Refresh."
Q: Do custom indicators slow down the platform? A: Too many complex indicators can impact performance; remove unused ones via the "Indicator List" (Ctrl+I).
Q: Can I use MT4 indicators on MT5? A: No, MQL4 and MQL5 are distinct languages; ensure the indicator is compiled specifically for your platform version.
What this tool does
KAMA Ribbon The idea behind it Perry Kaufman's Adaptive Moving Average (KAMA) changes its own speed depending on market conditions.
Typical Use Case
This Indicator excels in automated trading and technical analysis on MetaTrader 5.
Compatible Platform & Setup
This Indicator works on MetaTrader 5. Place the file in the MQL5/Indicators folder and restart the terminal.
Description & Settings
Related: Adaptive Super Trend K-Means - another powerful indicator for MetaTrader 5 traders.
KAMA Ribbon
The idea behind it
Perry Kaufman's Adaptive Moving Average (KAMA) changes its own speed depending on market conditions. It measures the
Also recommended: Volatility Regime Shader: Adaptive Volatility Classification for MT4/MT5 - similar indicator with strong performance on MetaTrader 5.
Efficiency Ratio (ER): the net price change over N bars divided by the sum of all bar-to-bar changes over the same N bars. ER is close to 1 when price moves in a straight line and close to 0 when it moves sideways with a lot of noise. The ER then sets the smoothing constant between a fast and a slow EMA. In a clean trend KAMA follows price closely, and in a choppy range it almost stops moving.
A single KAMA depends heavily on the ER period N. This indicator draws several KAMA lines at once. The first one uses a short ER period and each following one uses a longer period (by default 5, 8, 11 ... 26). Because every line measures "trendiness" over a different window, the ribbon shows how a trend develops across several horizons: lines fan out and line up when the move is persistent, and bunch together or cross when the market is ranging or turning.
Everything is calculated from the standard KAMA formula:
ER = |P[i] - P[i-N]| / Sum(|P[k] - P[k-1]|, N bars) SC = (ER * (2/(Fast+1) - 2/(Slow+1)) + 2/(Slow+1))^2 KAMA = KAMA[prev] + SC * (P[i] - KAMA[prev])
How to interpret it
Ribbon lines
– up to 8 KAMA lines. The fastest line (shortest ER period) is the brightest and thickest; the lines become darker gray as the ER period grows.
Bullish ribbon
– lines are fully ordered with the fastest line on top and the slowest at the bottom, and the ribbon is fanning out. This indicates a persistent up-move on all horizons.
Bearish ribbon
– the same order mirrored: the fastest line at the bottom and the slowest on top.
Twisted or bunched ribbon
– lines cross, overlap or flatten into a thin band. This is a range or a transition between trends. Adaptive lines hardly move in noise, so a flat, tight ribbon is a useful "stay out" sign.
Ribbon width
– the distance between the fastest and the slowest line. A widening ribbon means a strengthening trend; a narrowing one means the trend is fading.
Status label
– a text label (default: upper left corner) shows
BULL
,
BEAR
or
MIXED
and the ribbon width in points. It is evaluated on the last
closed
bar, so it does not flicker while the current bar is forming.
BULL
/
BEAR
require a strict ordering of all lines.
The indicator draws only in the main chart window. The values of all lines are available in the Data Window and through iCustom() (buffers 0–7, from the fastest to the slowest line).
External variables (inputs)
Input
Default
Purpose
InpRibbonCount
8
Number of KAMA lines in the ribbon (1–8). Unused plots are hidden.
InpFirstER
5
Efficiency Ratio period of the first (fastest) line.
InpERStep
3
Increment of the ER period for every next line. With the defaults the periods are 5, 8, 11, 14, 17, 20, 23, 26.
InpFastPeriod
2
Period of the fast EMA: the upper limit of adaptation, used when ER = 1.
InpSlowPeriod
30
Period of the slow EMA: the lower limit of adaptation, used when ER = 0. Must be greater than InpFastPeriod.
InpPrice
PRICE_CLOSE
Applied price used for the calculation.
InpShowStatus
true
Show or hide the on-chart status label.
InpCorner
CORNER_LEFT_UPPER
Chart corner in which the status label is placed.
InpStatusColor
clrWhite
Color of the status label text.
Invalid parameters (for example a count outside 1–8 or a slow period not greater than the fast period) stop the initialization and a message is printed to the Experts tab.
Recommended use
Symbols and timeframes
– the indicator works on any symbol and timeframe. The ER approach is most informative on M15–D1 charts of liquid instruments, where the difference between trend and noise is clear. On very low timeframes spread and tick noise keep ER low and the lines flat.
Trend filter
– use the
BULL
/
BEAR
/
MIXED
state as a filter for your own entries: trade pullbacks to the ribbon in the direction of an ordered, widening ribbon and avoid trading while it is twisted.
Tuning
– a larger
InpERStep
spreads the ribbon over more horizons, a smaller one gives a denser band. A smaller
InpFastPeriod
makes lines react faster in strong trends; a larger
InpSlowPeriod
makes them flatter in ranges.
Caveats
– KAMA is a lagging, non-repainting-on-closed-bars indicator: the values of the forming bar change with each tick, closed bars do not change. The ribbon does not provide entry signals by itself and should be combined with risk management and other analysis.
Account types
– the indicator only reads price data and does not trade, so it works the same on netting and hedging accounts.
Performance
– on the first run the whole history is calculated once; afterwards only the new and the forming bars are recalculated ( prev_calculated ). The chart label is created once and removed in OnDeinit() .
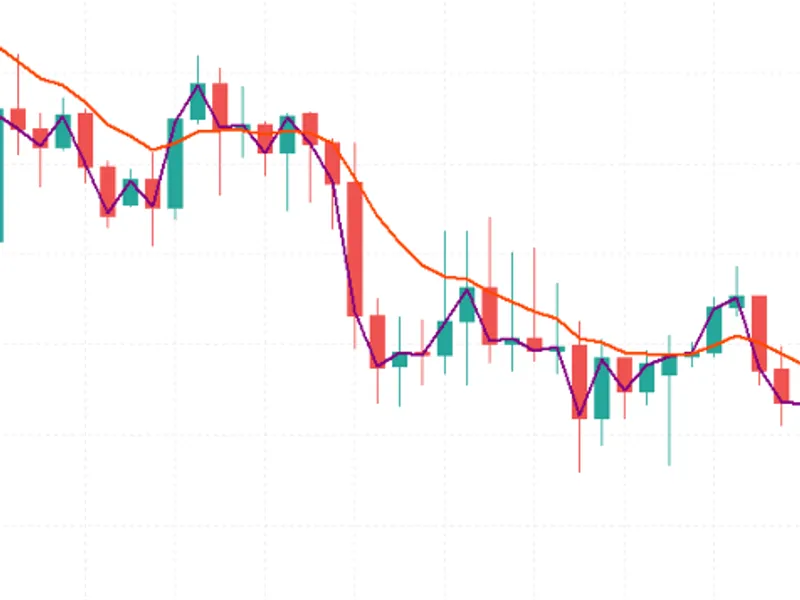
Fig. 1. KAMA Ribbon (8 lines) on a price chart; black & white image according to the Code Base image guidelines.
You may also like: Adaptive Kalman Trend Filter Indicator - excellent alternative for indicator users on MetaTrader 5.
Source Code
#property copyright "RobotFX"
#property link "https://robotfx.org"
#property version     "1.00"
#property description "This code is educational. Feel free to use, modify and upgrade as you wish. Visit ROBOTFX.ORG for professional trading tools"
#property indicator_chart_window
#property indicator_buffers 9
#property indicator_plots   8
#property indicator_type1   DRAW_LINE
#property indicator_type2   DRAW_LINE
#property indicator_type3   DRAW_LINE
.......
⚠ Limitations & Risk Warning
- This tool is provided for educational and testing purposes only.
- Past performance does not guarantee future results.
- Trading involves substantial risk of loss. Use on a demo account first.
- Results may vary depending on market conditions, broker, and settings.
- We recommend thorough backtesting and forward testing before using with real funds.