HL Bands
This professional-grade solution for MetaTrader 5 helps traders achieve greater efficiency in their daily workflow. This technical indicator acts as a specialized analysis tool designed to visualize market data. It helps traders identify emerging trends, momentum shifts, and key support or resistance levels by plotting statistical calculations directly onto price charts.
How to Setup and Use HL Bands
1. Installation: Place your file in the MQL/Indicators folder via "Open Data Folder" and restart your terminal.
2. Loading: Find the indicator in the Navigator, drag it onto your chart, and configure the input parameters in the popup window.
3. Customization: Press Ctrl+I to open the indicator list, select your tool, and click "Properties" to change colors, levels, or visual styles.
4. Updating: Replace the old file in the Indicators folder with the new version and restart the platform to apply changes.
Frequently Asked Questions
Q: Why is my indicator not showing? A: Verify the file is in the MQL/Indicators folder, or try right-clicking the "Indicators" tree in the Navigator and clicking "Refresh."
Q: Do custom indicators slow down the platform? A: Too many complex indicators can impact performance; remove unused ones via the "Indicator List" (Ctrl+I).
Q: Can I use MT4 indicators on MT5? A: No, MQL4 and MQL5 are distinct languages; ensure the indicator is compiled specifically for your platform version.
Description & Settings
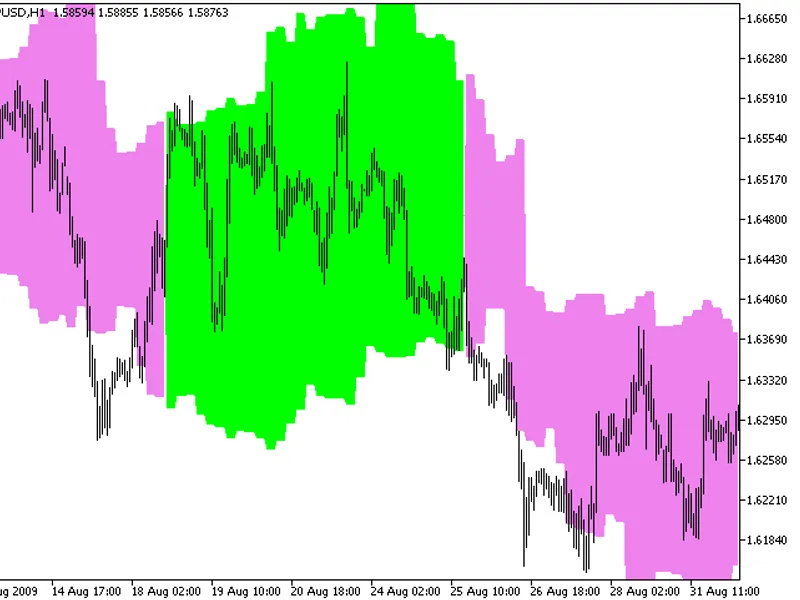
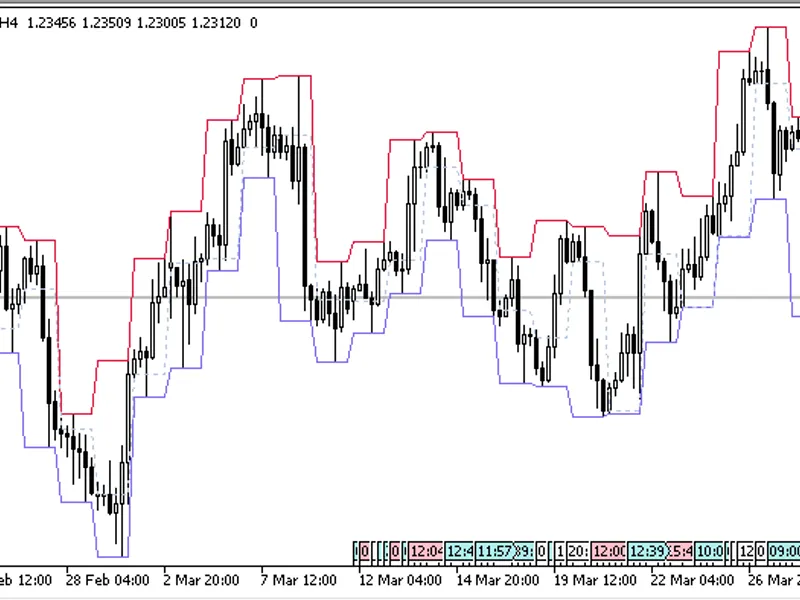
The indicator displays on the chart the Open, High and Low levels of the period specified in parameters.
You can choose between two level display modes:
High/Low;
Open/Close.
and two level update modes:
Only at the opening of the first candlestick of the selected period (showing High, Low and Open of the first candlestick of the specified timeframe);
Showing levels of the entire period of the specified timeframe.
It also allows setting the period to display levels on the chart.
The indicator has three input parameters:
Bands period
- the period of displayed levels;
Bands Update
- mode for updating levels:
at the opening of the bar
- only the current bar of the selected timeframe is updated, after that levels remain unchanged on all bars of the selected period;
always
- levels are updated when the price exceeds previous levels, i.e. minimum/maximum levels for the whole period are shown.
Bands Applied price
- the open line of the selected period is always displayed, you can choose between two level display modes: the High/Low levels of candlesticks and the Open/Close levels of candlesticks.
Fig.1. The D1 period on the H4 chart, High/Low levels, update mode "always"
Fig.2. The D1 period on the H4 chart, High/Low levels, update only at the first bar of the period
Fig.3. The D1 period on the H4 chart, Open/Close levels, update mode "always"
Fig.4. The D1 period on the H4 chart, Open/Close levels, update only at the first bar of the period