Fourier extrapolation of price
This software component for MetaTrader 5 is built to enhance the capabilities of your trading environment. This technical indicator acts as a specialized analysis tool designed to visualize market data. It helps traders identify emerging trends, momentum shifts, and key support or resistance levels by plotting statistical calculations directly onto price charts.
How to Setup and Use Fourier extrapolation of price
1. Installation: Place your file in the MQL/Indicators folder via "Open Data Folder" and restart your terminal.
2. Loading: Find the indicator in the Navigator, drag it onto your chart, and configure the input parameters in the popup window.
3. Customization: Press Ctrl+I to open the indicator list, select your tool, and click "Properties" to change colors, levels, or visual styles.
4. Updating: Replace the old file in the Indicators folder with the new version and restart the platform to apply changes.
Frequently Asked Questions
Q: Why is my indicator not showing? A: Verify the file is in the MQL/Indicators folder, or try right-clicking the "Indicators" tree in the Navigator and clicking "Refresh."
Q: Do custom indicators slow down the platform? A: Too many complex indicators can impact performance; remove unused ones via the "Indicator List" (Ctrl+I).
Q: Can I use MT4 indicators on MT5? A: No, MQL4 and MQL5 are distinct languages; ensure the indicator is compiled specifically for your platform version.
Description & Settings
A multi-harmonic (or multi-tone) trigonometric model of a price series x[i], i=1..n, is given by:
x[i] = m + Sum( a[h]*Cos(w[h]*i) + b[h]*Sin(w[h]*i), h=1..H )
where:
x[i] - past price at i-th bar, total n past prices;
m - bias;
a[h] and b[h] - scaling coefficients of harmonics;
w[h] - frequency of a harmonic;
h - harmonic number;
H - total number of fitted harmonics.
Fitting this model means finding m, a[h], b[h], and w[h] that make the modeled values to be close to real values. Finding the harmonic frequencies w[h] is the most difficult part of fitting a trigonometric model. In the case of a Fourier series, these frequencies are set at 2*pi*h/n. But, the Fourier series extrapolation means simply repeating the n past prices into the future.
This indicator uses the Quinn-Fernandes algorithm to find the harmonic frequencies. It fits harmonics of the trigonometric series one by one until the specified total number of harmonics H is reached. After fitting a new harmonic, the coded algorithm computes the residue between the updated model and the real values and fits a new harmonic to the residue.
The indicator has the following input parameters:
Npast - number of past bars, to which trigonometric series is fitted;
Nfut - number of predicted future bars;
Nharm - total number of harmonics in model;
FreqTOL - tolerance of frequency calculations.
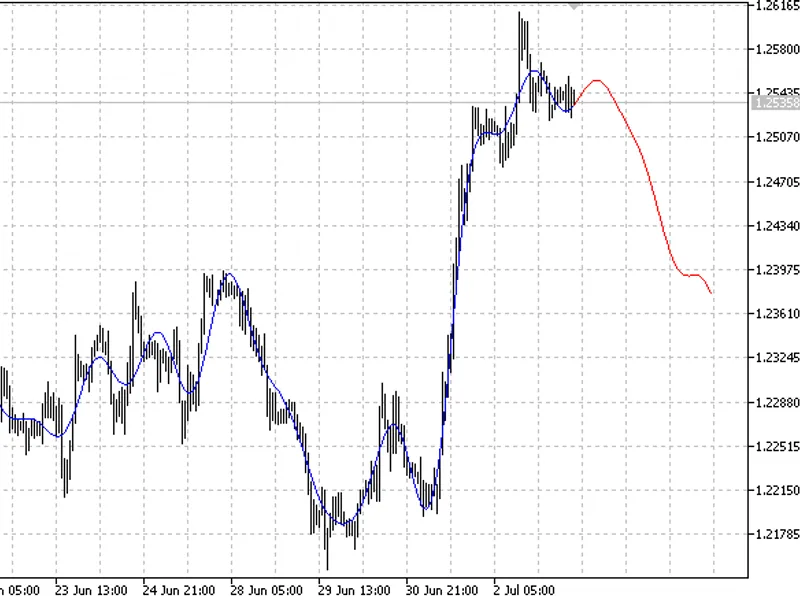
The indicator plots two curves: the blue curve indicates modeled past values and the red curve indicates the modeled future values.