AR extrapolation of price
This is a powerful addition to your MetaTrader 5 toolkit designed to optimize market analysis and performance. This technical indicator acts as a specialized analysis tool designed to visualize market data. It helps traders identify emerging trends, momentum shifts, and key support or resistance levels by plotting statistical calculations directly onto price charts.
How to Setup and Use AR extrapolation of price
1. Installation: Place your file in the MQL/Indicators folder via "Open Data Folder" and restart your terminal.
2. Loading: Find the indicator in the Navigator, drag it onto your chart, and configure the input parameters in the popup window.
3. Customization: Press Ctrl+I to open the indicator list, select your tool, and click "Properties" to change colors, levels, or visual styles.
4. Updating: Replace the old file in the Indicators folder with the new version and restart the platform to apply changes.
Frequently Asked Questions
Q: Why is my indicator not showing? A: Verify the file is in the MQL/Indicators folder, or try right-clicking the "Indicators" tree in the Navigator and clicking "Refresh."
Q: Do custom indicators slow down the platform? A: Too many complex indicators can impact performance; remove unused ones via the "Indicator List" (Ctrl+I).
Q: Can I use MT4 indicators on MT5? A: No, MQL4 and MQL5 are distinct languages; ensure the indicator is compiled specifically for your platform version.
Description & Settings
An autoregressive (AR) (or linear prediction) model is given by:
x[n] = -Sum(a[i]*x[n - i], i = 1..p)
where:
x[n] is the predicted value of a time series;
x[n-p]..x[n-1] are known past values of the same series;
a[1]..a[p] are the model coefficients, and p is the model order.
The model coefficients a[1]..a[p] can be fitted to the past data by a variety of methods. This indicator uses the Burg method.
The inputs of the indicator are:
UseDiff - a boolean switch to use price differences instead of prices themselves
Ncoef - number of model coefficients (model order)
Nfut - number of future bars
kPast - number of past bars in increments of Ncoef (must be >=1)
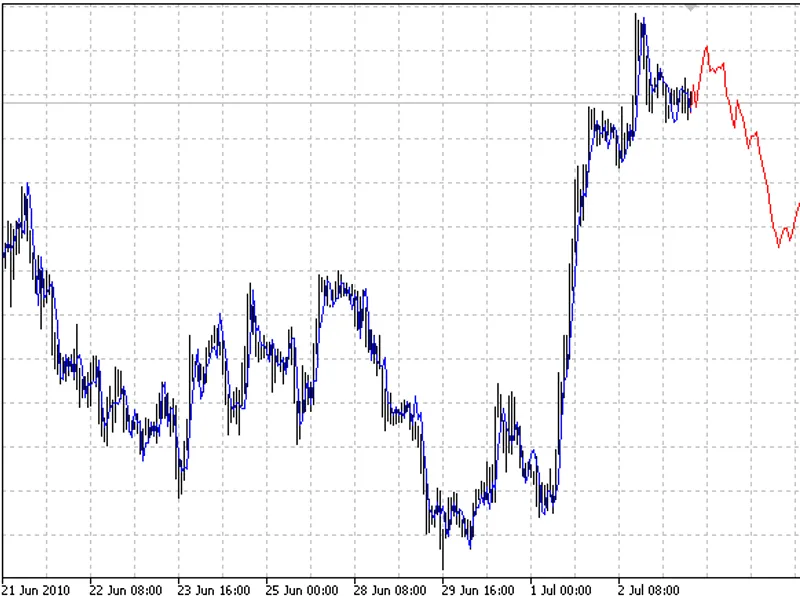
The indicator plots two curves: the blue curve represents the model outputs during its fitting, the red curve shows predicted future prices.
UseDiff=false:
UseDiff=true: