Five Tirone Levels
This tool for MetaTrader 5 is specifically engineered to streamline your trading operations. This technical indicator acts as a specialized analysis tool designed to visualize market data. It helps traders identify emerging trends, momentum shifts, and key support or resistance levels by plotting statistical calculations directly onto price charts.
How to Setup and Use Five Tirone Levels
1. Installation: Place your file in the MQL/Indicators folder via "Open Data Folder" and restart your terminal.
2. Loading: Find the indicator in the Navigator, drag it onto your chart, and configure the input parameters in the popup window.
3. Customization: Press Ctrl+I to open the indicator list, select your tool, and click "Properties" to change colors, levels, or visual styles.
4. Updating: Replace the old file in the Indicators folder with the new version and restart the platform to apply changes.
Frequently Asked Questions
Q: Why is my indicator not showing? A: Verify the file is in the MQL/Indicators folder, or try right-clicking the "Indicators" tree in the Navigator and clicking "Refresh."
Q: Do custom indicators slow down the platform? A: Too many complex indicators can impact performance; remove unused ones via the "Indicator List" (Ctrl+I).
Q: Can I use MT4 indicators on MT5? A: No, MQL4 and MQL5 are distinct languages; ensure the indicator is compiled specifically for your platform version.
Description & Settings
John Tirone
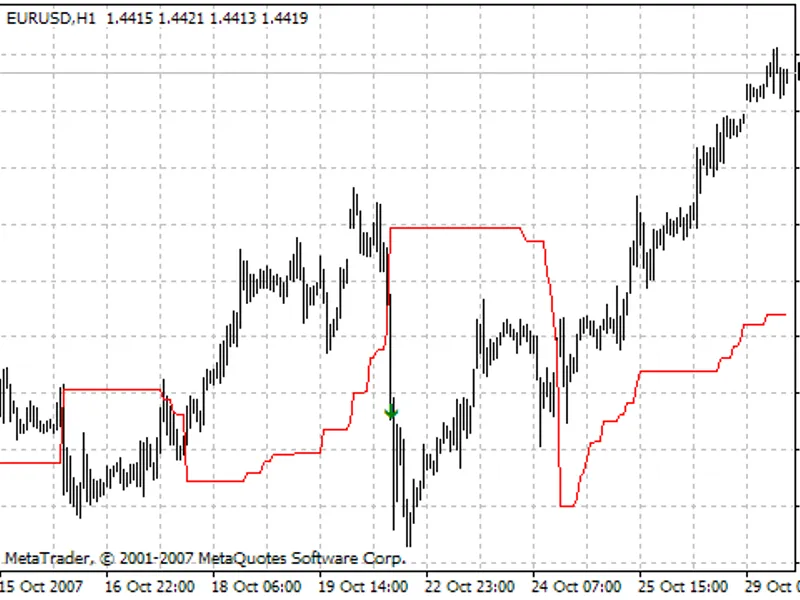
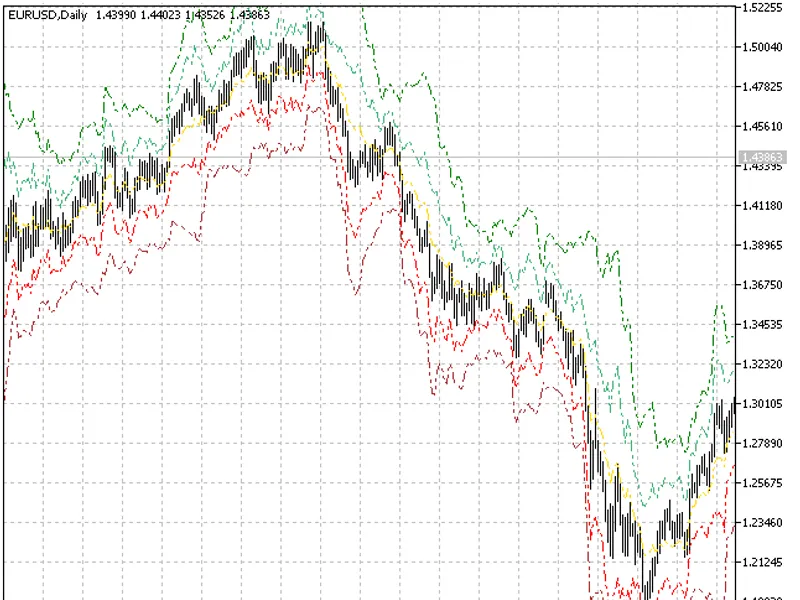
Tirone Levels are a series of several successively decreasing horizontal lines used to determine possible support and resistance areas on a price chart.
This technical analysis method is developed by John Tirone in his book "Classical Technical Analysis as a Powerful Trading Methodology". The system based on five Tirone levels is constructed using the Adjusted Mean method.
This method generates 5 often non-symmetrical lines.
Adjusted average value (Adjusted Mean) is found at first;
The next line is found by deducting the minimum from the Adjusted Mean multiplied by 2;
The third line is the Adjusted mean itself (adjusted average);
The next line is calculated by deducting the maximum from the Adjusted Mean multiplied by 2;
The lowest line is calculated by deducting the minimum from the maximum and deducting this result from the Adjusted Mean.
The levels are calculated the following way:
where:
Hhigh (Highest High) - the highest price for a certain period, for example, 20 bars;
Llow (Lowest Low) - the lowest value for a certain period, for example, 20 bars;
Close - close price of a current bar.