False Breakouts Counter
This professional-grade solution for MetaTrader 5 helps traders achieve greater efficiency in their daily workflow. This technical indicator acts as a specialized analysis tool designed to visualize market data. It helps traders identify emerging trends, momentum shifts, and key support or resistance levels by plotting statistical calculations directly onto price charts.
How to Setup and Use False Breakouts Counter
1. Installation: Place your file in the MQL/Indicators folder via "Open Data Folder" and restart your terminal.
2. Loading: Find the indicator in the Navigator, drag it onto your chart, and configure the input parameters in the popup window.
3. Customization: Press Ctrl+I to open the indicator list, select your tool, and click "Properties" to change colors, levels, or visual styles.
4. Updating: Replace the old file in the Indicators folder with the new version and restart the platform to apply changes.
Frequently Asked Questions
Q: Why is my indicator not showing? A: Verify the file is in the MQL/Indicators folder, or try right-clicking the "Indicators" tree in the Navigator and clicking "Refresh."
Q: Do custom indicators slow down the platform? A: Too many complex indicators can impact performance; remove unused ones via the "Indicator List" (Ctrl+I).
Q: Can I use MT4 indicators on MT5? A: No, MQL4 and MQL5 are distinct languages; ensure the indicator is compiled specifically for your platform version.
Description & Settings
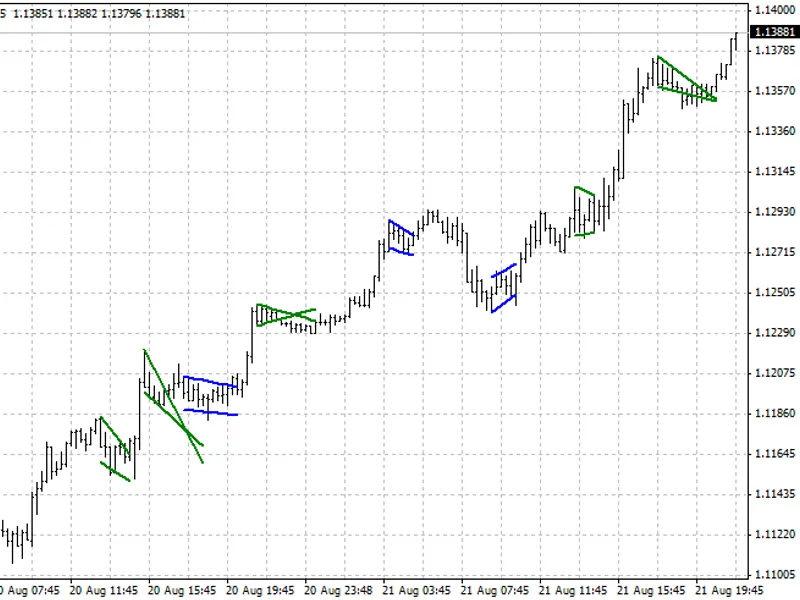
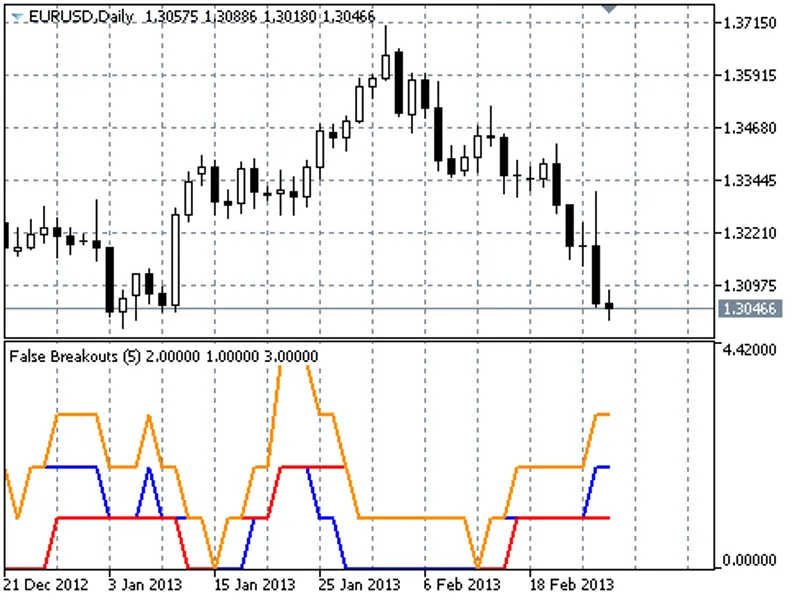
The idea is rather simple. If high of the current bar is higher than high of the previous bar, and close of the current bar is lower than high of the previous bar, it is considered as a false breakthrough up. Correspondingly, if low of the current bar is lower than low of the previous bar and close of the current bar is higher than low of the previous bar, we have a false breakthrough down.
There are situations when in one bar will be two false breakthroughs - if the bar is an external in relation to the previous bar, and its close is in the previous bar's range. The indicator displays:
the number of false breakthroughs up (blue line).
the number of false breakthroughs down (red line).
the total number of false breakthroughs (orange line).
The essence is that if, for example, on the last five bars were 3 (or more) false breakthroughs, then, most probably, the next breakthrough high or low (the previous bar) will be true.
Recommendations:
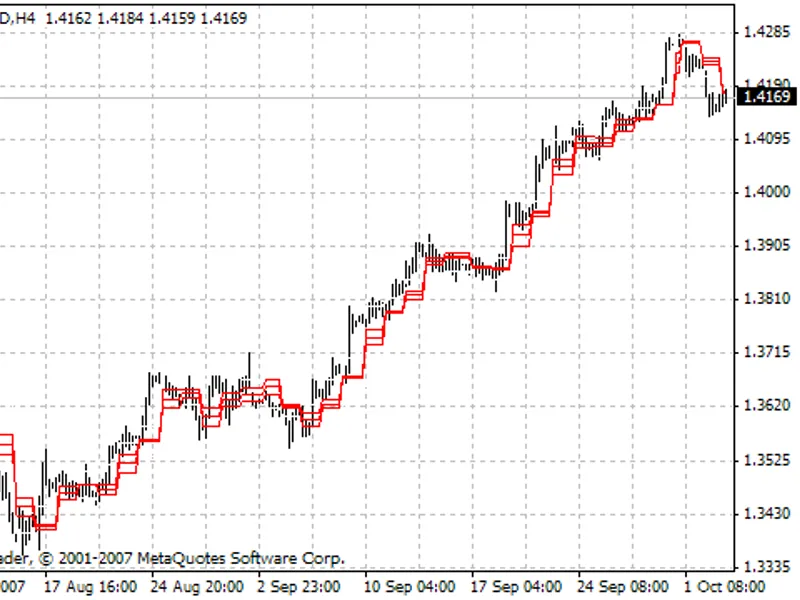
it is recommended to use the indicator not lower than Н4 period.
as the indicator doesn't specify the direction of a potential breakthrough, we can use it either in combination with stop orders below/above the previous bar's extremums, or in combination with a trend indicator and place stop order for the breakthrough only in the trend direction.