False Breakups
This software component for MetaTrader 5 is built to enhance the capabilities of your trading environment. This technical indicator acts as a specialized analysis tool designed to visualize market data. It helps traders identify emerging trends, momentum shifts, and key support or resistance levels by plotting statistical calculations directly onto price charts.
How to Setup and Use False Breakups
1. Installation: Place your file in the MQL/Indicators folder via "Open Data Folder" and restart your terminal.
2. Loading: Find the indicator in the Navigator, drag it onto your chart, and configure the input parameters in the popup window.
3. Customization: Press Ctrl+I to open the indicator list, select your tool, and click "Properties" to change colors, levels, or visual styles.
4. Updating: Replace the old file in the Indicators folder with the new version and restart the platform to apply changes.
Frequently Asked Questions
Q: Why is my indicator not showing? A: Verify the file is in the MQL/Indicators folder, or try right-clicking the "Indicators" tree in the Navigator and clicking "Refresh."
Q: Do custom indicators slow down the platform? A: Too many complex indicators can impact performance; remove unused ones via the "Indicator List" (Ctrl+I).
Q: Can I use MT4 indicators on MT5? A: No, MQL4 and MQL5 are distinct languages; ensure the indicator is compiled specifically for your platform version.
Description & Settings
Indicator documentation "FakeBreaks.mq5"
Overview
The "False Breakouts.mq5" indicator is designed to identify and mark on the chart:
Buy Points
and
Sell Points
based on false breakouts of support and resistance.
Dynamic
support
and
resistance
levels
.
Market
tops
and
bottoms
.
It uses buffers to store and display this information on the chart, making it easier to visually analyse false breakout patterns.
Code Structure
Indicator Properties
Indicator Name:
FalseBreakouts.mq5
Display Window:
Main chart ( indicator_chart_window ).
Buffers and Plots
The indicator uses
6 buffers
to store data and
6 plots
to display it on the chart:
Buy
:
Type: DRAW_ARROW (up arrow).
Colour: Blue (clrBlue).
Width: 5.
Sell
:
Type: DRAW_ARROW (down arrow).
Colour: Red ( clrRed ).
Width: 5.
Support
:
Type: DRAW_LINE (solid line).
Colour: Blue (clrBlue).
Resistance
:
Type: DRAW_LINE (continuous line).
Colour: Red ( clrRed ).
Bottom
:
Type: DRAW_ARROW (down arrow).
Colour: Red ( clrRed ).
Top
:
Type: DRAW_ARROW (up arrow).
Colour: Blue ( clrBlue ).
Global Variables
ExtResistancesBuffer[] : Stores the resistance levels.
ExtSupportsBuffer[] : Stores the support levels.
ExtTopsBuffer[] : Stores identified tops.
ExtBottomsBuffer[] : Stores identified bottoms.
ExtSellBuffer[] : Stores the selling points.
ExtBuyBuffer[] : Stores the buy points.
Main functions
1. OnInit()
Purpose:
Initialises the indicator and maps the buffers.
Actions
:
Maps the buffers to the plots.
Sets empty values ( PLOT_EMPTY_VALUE ) for the buffers.
Sets the arrows (icons) for Buy and Sell.
Defines the displacement of the arrows on the graph.
2. OnCalculate()
Purpose:
Calculates and updates the buffers with each new candle or tick.
Actions
:
Checks for new data to process.
Initialises the buffers if necessary.
Identifies tops ( IS_TOP ) and bottoms ( IS_BOTTOM ) based on the high and low prices.
Updates the resistance, support, top and bottom buffers.
Calls the IsBuy() and IsSell() functions to identify buy and sell points.
3. IndexNextPoint()
Purpose:
Finds the index of the next valid (non-zero) point in a buffer.
Use:
Used by the IsBuy() and IsSell() functions to identify the most recent reference point.
4. IsBuy()
Purpose:
Checks for a buy signal based on a false break of support.
Logic
:
Checks whether the current price is above the reference point (support).
Confirms if there has been a false breakout (price falls below and then returns above support).
Returns true if the conditions are met.
5. IsSell()
Purpose:
Checks for a sell signal based on a false breakout of resistance.
Logic
:
Checks whether the current price is below the reference point (resistance).
Confirms if there has been a false breakout (price rises above and then returns below resistance).
Returns true if the conditions are met.
Operating Logic
Identification of Tops and Bottoms:
A
top
is identified when the high of the current candle is higher than the highs of the adjacent candles.
A
bottom
is identified when the low of the current candle is lower than the lows of the adjacent candles.
Updating Support and Resistance:
The last identified top is stored as resistance.
The last identified bottom is stored as support.
Buy and Sell Signals:
A
buy
signal is generated when the price breaks through a support and then returns above it.
A
sell
signal is generated when the price breaks through resistance and then returns below it.
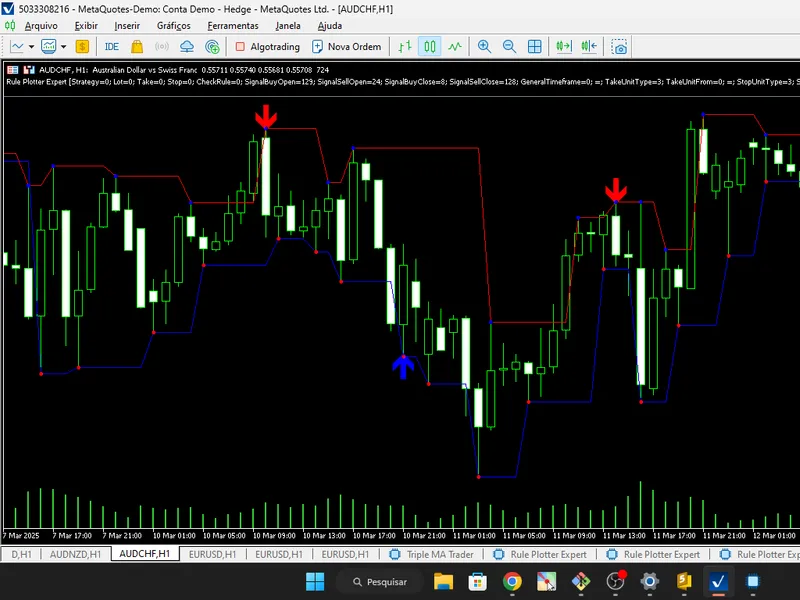
Example of use
The indicator can be applied to any chart in MetaTrader 5.
It will display:
Blue arrows for buy points.
Red arrows for sell points.
Blue lines for support.
Red lines for resistances.
Additional arrows for tops and bottoms.
Final considerations
The indicator is useful for traders who trade on the basis of false breakouts of support and resistance.
It is recommended to test the indicator on different markets and timeframes to validate its effectiveness.
It can be customised to include sound alerts or notifications when a signal is generated.