Divergence Awesome Ocilator
This professional-grade solution for MetaTrader 5 helps traders achieve greater efficiency in their daily workflow. This technical indicator acts as a specialized analysis tool designed to visualize market data. It helps traders identify emerging trends, momentum shifts, and key support or resistance levels by plotting statistical calculations directly onto price charts.
How to Setup and Use Divergence Awesome Ocilator
1. Installation: Place your file in the MQL/Indicators folder via "Open Data Folder" and restart your terminal.
2. Loading: Find the indicator in the Navigator, drag it onto your chart, and configure the input parameters in the popup window.
3. Customization: Press Ctrl+I to open the indicator list, select your tool, and click "Properties" to change colors, levels, or visual styles.
4. Updating: Replace the old file in the Indicators folder with the new version and restart the platform to apply changes.
Frequently Asked Questions
Q: Why is my indicator not showing? A: Verify the file is in the MQL/Indicators folder, or try right-clicking the "Indicators" tree in the Navigator and clicking "Refresh."
Q: Do custom indicators slow down the platform? A: Too many complex indicators can impact performance; remove unused ones via the "Indicator List" (Ctrl+I).
Q: Can I use MT4 indicators on MT5? A: No, MQL4 and MQL5 are distinct languages; ensure the indicator is compiled specifically for your platform version.
Description & Settings
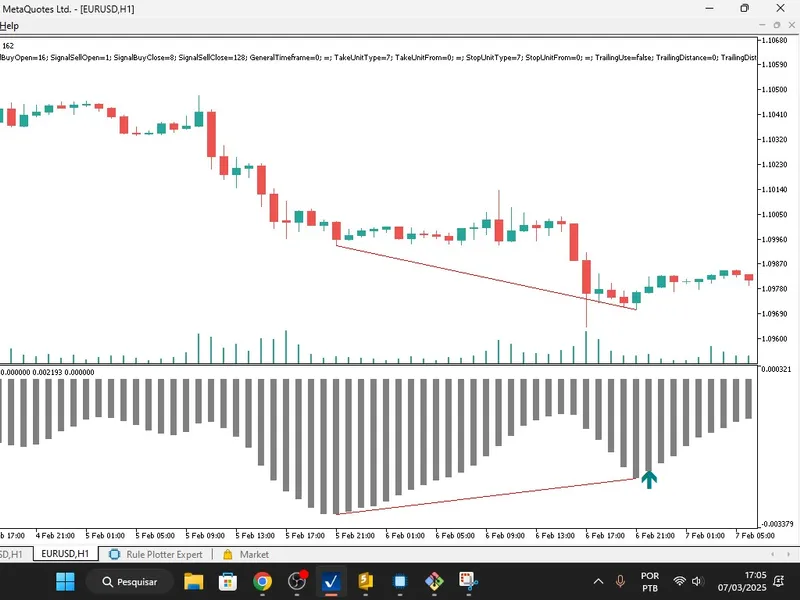
This MQL5 code is a custom indicator designed to detect and visualise
divergences
between price action and the
Awesome Oscillator (AO)
. Divergences occur when the price movement and the oscillator movement are not aligned, often signalling potential reversals or continuations in the market. The indicator plots buy/sell signals, a histogram of the AO, and trendlines to highlight these divergences.
Key Features of the Indicator:
Divergence Detection
:
Detects
bullish divergences
(price makes lower lows while AO makes higher lows).
Detects
bearish divergences
(price makes higher highs while AO makes lower highs).
Visualisation
:
Buy/Sell Arrows
: Plots arrows on the chart to indicate potential buy or sell signals based on divergences.
Histogram
: Displays the Awesome Oscillator (AO) values as a histogram.
Trendlines
: Draws trendlines on the chart to highlight the divergences between price and AO.
Custom Buffers
:
Uses four buffers to store data:
BuyBuffer and SellBuffer for buy/sell signals.
HistogramBuffer for AO values.
PointsCounterBuffer to track aligned points for divergence confirmation.
Dynamic Trendline Drawing
:
Uses CChartObjectTrend to dynamically draw trendlines on the chart for price and AO.
Crossing Check
:
Includes a function ( CheckCrossing ) to verify if the price or AO crosses a trendline, which helps confirm or invalidate a divergence.
Interpolation
:
Uses linear interpolation ( CalculateIntermediateValue ) to calculate intermediate values between two points, which is used to check for crossings.
How it works:
Initialisation
:
The OnInit() function sets up the indicator buffers, assigns properties (e.g., colours, styles), and initializes the Awesome Oscillator (AO) handle.
Main Calculation
:
The OnCalculate() function processes price and AO data to detect divergences:
Identifies
bottoms
(lower lows) and
tops
(higher highs) in both price and AO.
Checks for divergences by comparing price and AO trends.
Plots buy/sell signals and draws trendlines when a divergence is confirmed.
Divergence Confirmation
:
Uses conditions like IsBullishTrend and IsBearishTrend to confirm divergences.
Ensures no crossing occurs between the price and AO trendlines to validate the divergence.
Dynamic Updates
:
The indicator dynamically updates with each new bar, recalculating divergences and redrawing trendlines as needed.
Key Functions:
IsBottom() and IsTop()
:
Detect local minima (bottoms) and maxima (tops) in an array (price or AO).
CheckCrossing()
:
Checks if the price or AO crosses a trendline, which can invalidate a divergence.
CalculateIntermediateValue()
:
Calculates intermediate values using linear interpolation for trendline analysis.
AddUniqueCoordinates()
:
Ensures unique coordinates are added to the array for trendline drawing.
TotalAligned()
:
Counts the number of aligned points to confirm divergence strength.
Usage:
This indicator is useful for traders who rely on divergence strategies to identify potential reversals or continuations in the market.
It provides visual cues (arrows, trendlines, and histograms) to help traders make informed decisions.
Example Scenario:
If the price is making
lower lows
(bearish), but the AO is making
higher lows
(bullish), a
bullish divergence
is detected. The indicator will plot a
buy arrow
and draw trendlines to highlight the divergence.
Conversely, if the price is making
higher highs
(bullish), but the AO is making
lower highs
(bearish), a
bearish divergence
is detected. The indicator will plot a
sell arrow
and draw trendlines.
Technical Details:
Platform
: MetaTrader 5 (MT5).
Language
: MQL5.
Dependencies
: Uses the Awesome Oscillator ( iAO ) for calculations.
Custom Objects
: Utilises CChartObjectTrend for drawing trendlines and CArrayInt for managing arrays of coordinates.
This indicator is a powerful tool for traders who want to automate divergence detection and visualisation, saving time and improving accuracy in their trading strategies.