Differential indicator by Sultonov
This software component for MetaTrader 5 is built to enhance the capabilities of your trading environment. This technical indicator acts as a specialized analysis tool designed to visualize market data. It helps traders identify emerging trends, momentum shifts, and key support or resistance levels by plotting statistical calculations directly onto price charts.
How to Setup and Use Differential indicator by Sultonov
1. Installation: Place your file in the MQL/Indicators folder via "Open Data Folder" and restart your terminal.
2. Loading: Find the indicator in the Navigator, drag it onto your chart, and configure the input parameters in the popup window.
3. Customization: Press Ctrl+I to open the indicator list, select your tool, and click "Properties" to change colors, levels, or visual styles.
4. Updating: Replace the old file in the Indicators folder with the new version and restart the platform to apply changes.
Frequently Asked Questions
Q: Why is my indicator not showing? A: Verify the file is in the MQL/Indicators folder, or try right-clicking the "Indicators" tree in the Navigator and clicking "Refresh."
Q: Do custom indicators slow down the platform? A: Too many complex indicators can impact performance; remove unused ones via the "Indicator List" (Ctrl+I).
Q: Can I use MT4 indicators on MT5? A: No, MQL4 and MQL5 are distinct languages; ensure the indicator is compiled specifically for your platform version.
Description & Settings
Indicator lines show the accumulated sums of bulls and bears power for the user-defined period.
Method of Calculation
Bulls power is calculated by the following formula:
BullsPower(i) = SUM(Close(i) - Close(i + 1), N) / BUN
where the following applies:
BullsPower(i)
- the current bulls power.
Close(i)
- the Close price of the current bar.
Close(i + 1)
- the Close price of the previous bar.
N
- indicator calculation period.
BUN
- the number of positive increments of Close prices over N bars. The sum includes only positive increments.
Accordingly, the following formula is used for calculating the bears power:
BearsPower(i) = SUM(Close(i + 1) - Close(i), N) / BEN
where the following applies:
BearsPower(i)
- the current bears power.
BEN
- the number of negative increments of Close prices over N bars. The sum includes only negative increments. Parameters
Calculate period
- the number of past bars used for the calculation of indicator values (specified as N in the formulas).
The number of bars to display
- the number of past bars, on which the indicator values will be displayed. To display the indicator on the whole available history, enter any unnatural number (0 or less). The parameter does not affect the indicator quality. Interpretation
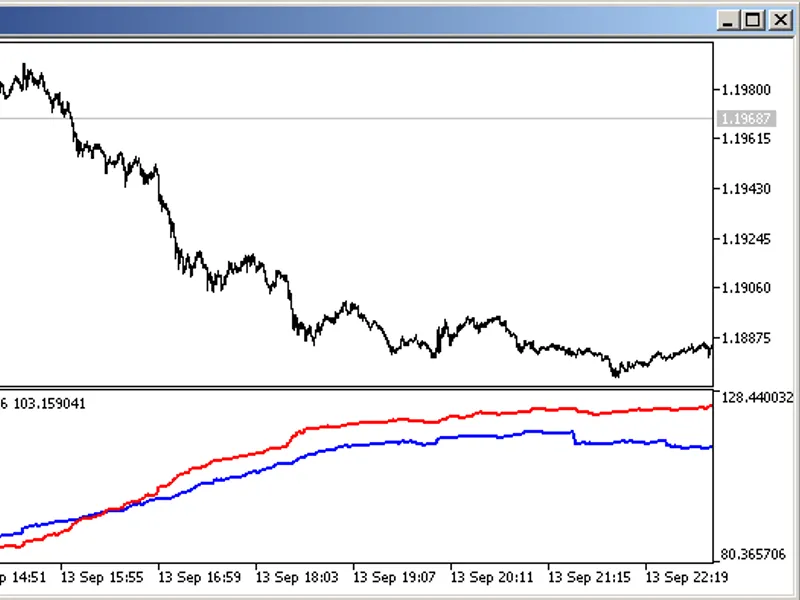
The red indicator line shows the bears power, and the blue line indicates the bulls power. The higher line shows the stronger side. The intersection of lines indicates trend change and is a good moment for opening a deal in the direction of the power that appeared to be above the other one.
Fig. 1. Change of an uptrend to a downtrend.
Update 22.09.2017
The error in recognizing the Russian language of the terminal has been fixed.