Derivative
This software component for MetaTrader 5 is built to enhance the capabilities of your trading environment. This technical indicator acts as a specialized analysis tool designed to visualize market data. It helps traders identify emerging trends, momentum shifts, and key support or resistance levels by plotting statistical calculations directly onto price charts.
How to Setup and Use Derivative
1. Installation: Place your file in the MQL/Indicators folder via "Open Data Folder" and restart your terminal.
2. Loading: Find the indicator in the Navigator, drag it onto your chart, and configure the input parameters in the popup window.
3. Customization: Press Ctrl+I to open the indicator list, select your tool, and click "Properties" to change colors, levels, or visual styles.
4. Updating: Replace the old file in the Indicators folder with the new version and restart the platform to apply changes.
Frequently Asked Questions
Q: Why is my indicator not showing? A: Verify the file is in the MQL/Indicators folder, or try right-clicking the "Indicators" tree in the Navigator and clicking "Refresh."
Q: Do custom indicators slow down the platform? A: Too many complex indicators can impact performance; remove unused ones via the "Indicator List" (Ctrl+I).
Q: Can I use MT4 indicators on MT5? A: No, MQL4 and MQL5 are distinct languages; ensure the indicator is compiled specifically for your platform version.
Description & Settings
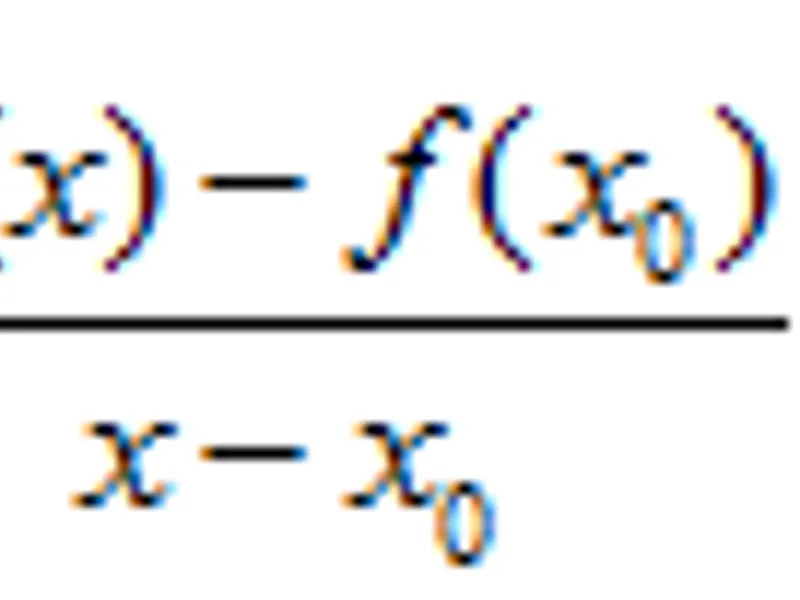
In mathematics, the value of the derivative is calculated according to the following simple formula:
, (1)
where:
x0 — current value of the argument,
x — value of the argument to the right of the chart,
f(x0) — value of the function at point x0,
f(x) — value of the function at point х.
In the original definition the difference between x and x0 is infinitesimal, i.e. the limit of the function is used. Using the formula (1) it is possible to calculate the approximate value of the derivative using the fuction values, avoiding direct differentiation.
Regarding the price chart, x0 is the current bar, and x is the upcoming bar, which will be formed after a number of chart periods. Respectively, f(x0) is the price value on the current bar, and f(x) is the price value of the upcoming bar. We find that (1) contains two unknowns — f(x0) and f(x). Since we do not have additional expressions which contain the same two unknowns, the solution of equation (1) in this case is absent.
Known values must be taken as f(x) and f(x0) to make it possible to find the derivative f'(x0). For that purpose it is necessary to take a point to the left of the current bar as x0, and to designate the current bar as x. As a result, f(x0) and f(x) become certain values (prices at points x and x0 correspond to the price values visible on the chart).
Although, the calculated value will characterize an area already known to a trader, in which the price growth or fall can be judged without the help of the derivative. In this case the useful information is not simply the value of the derivative, but the comparison of two values of the derivative at adjacent bars. In case the signs of the calculated values are different the price has passed an extremum. The type of the extremum can be easily determined using the combination of signs: transition from negative value to positive value is minimum, positive to negative — maximum.
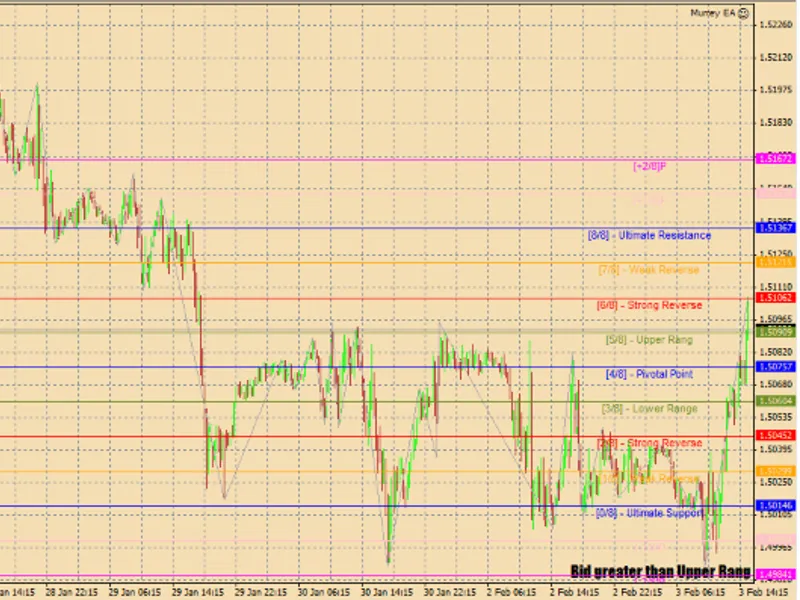
The described principle of calculation of a derivative is implemented in the Derivative indicator. As a result it displays the difference of prices between the examined bar and the bar spaced from the examined one by a number of bars set in the "Delay" parameter.
The easiest way to use the indicator is this: the line crosses the zero level from below — you should buy, from above — you should sell.
Originally this indicator has been written in MQL4 and was first published in the on 09.09.2015.
Fig.1. The Derivative indicator