Exp Color XDerivative
This tool for MetaTrader 5 is specifically engineered to streamline your trading operations. This Expert Advisor serves as automated trading software. It is utilized to monitor financial markets and execute trades based on predefined algorithmic rules, enabling precise position management without the need for constant manual oversight.
How to Setup and Use Exp Color XDerivative
1. Installation: Open the "File" menu, select "Open Data Folder," navigate to MQL/Experts, paste your file, and restart the terminal.
2. Activation: Drag the EA from the Navigator onto a chart, ensure "Allow live trading" is checked in the Common tab, and verify the AutoTrading button is green.
3. Optimization: Right-click your chart, choose "Expert List," click "Properties" to adjust inputs, and save your preferred setup as a set file for future use.
4. Maintenance: Regularly check the "Experts" tab in the terminal window to monitor trade logs and potential execution errors.
Frequently Asked Questions
Q: Why is my EA not opening trades? A: Check the "AutoTrading" button, ensure "Allow live trading" is enabled, and verify your broker allows automated trading on your account type.
Q: Can I run multiple EAs on one chart? A: No, each chart can only host one active EA; however, you can open multiple charts for different currency pairs to run several EAs.
Q: What does the "smiley face" icon mean? A: A smiley face in the top-right corner of the chart indicates the EA is successfully running; a frowny face means it is disabled.
Description & Settings
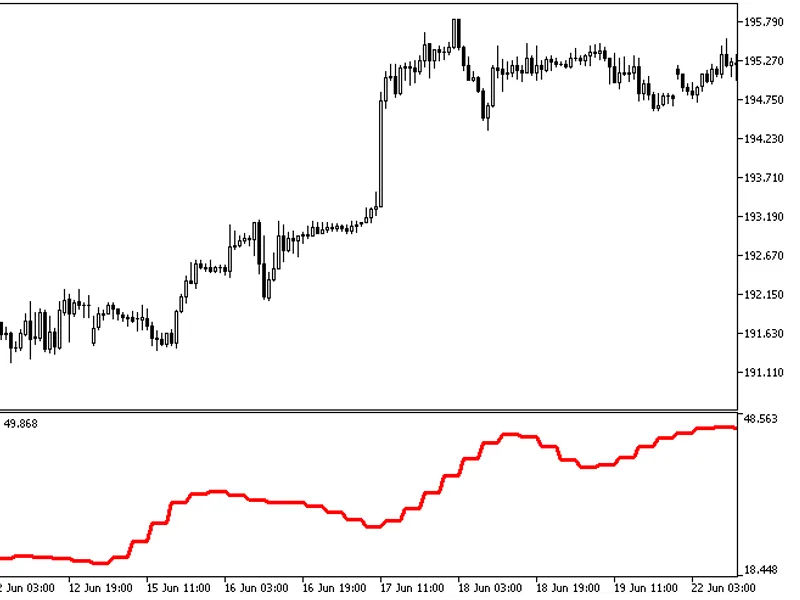
A trading system based on the signals of the indicator. The signal is formed when a bar is closing if there is a change in the oscillator direction.
For the EA to operate correctly, the compiled file of indicator
ColorXDerivative.ex5
must be in the <terminal_data_directory>\MQL5\Indicators folder.
In the texts below, the default inputs of the EA are used. Stop Loss and Take Profit have not been used during the tests.
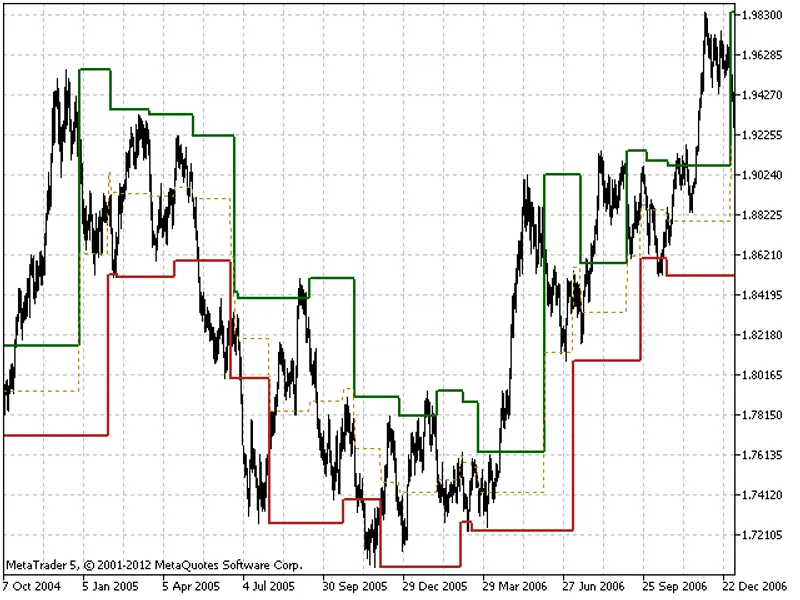
Fig. 1. Examples of deals on the chart
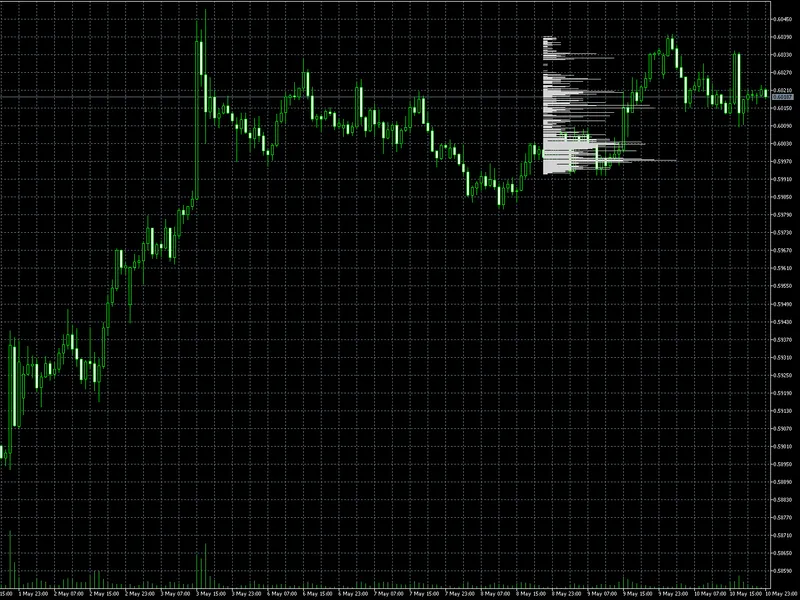
Testing results for GBPUSD H12 over the year 2016:
Fig. 2. Testing results chart