Daily Pivot Shift
This tool for MetaTrader 5 is specifically engineered to streamline your trading operations. This technical indicator acts as a specialized analysis tool designed to visualize market data. It helps traders identify emerging trends, momentum shifts, and key support or resistance levels by plotting statistical calculations directly onto price charts.
How to Setup and Use Daily Pivot Shift
1. Installation: Place your file in the MQL/Indicators folder via "Open Data Folder" and restart your terminal.
2. Loading: Find the indicator in the Navigator, drag it onto your chart, and configure the input parameters in the popup window.
3. Customization: Press Ctrl+I to open the indicator list, select your tool, and click "Properties" to change colors, levels, or visual styles.
4. Updating: Replace the old file in the Indicators folder with the new version and restart the platform to apply changes.
Frequently Asked Questions
Q: Why is my indicator not showing? A: Verify the file is in the MQL/Indicators folder, or try right-clicking the "Indicators" tree in the Navigator and clicking "Refresh."
Q: Do custom indicators slow down the platform? A: Too many complex indicators can impact performance; remove unused ones via the "Indicator List" (Ctrl+I).
Q: Can I use MT4 indicators on MT5? A: No, MQL4 and MQL5 are distinct languages; ensure the indicator is compiled specifically for your platform version.
Description & Settings
MetaQuotes
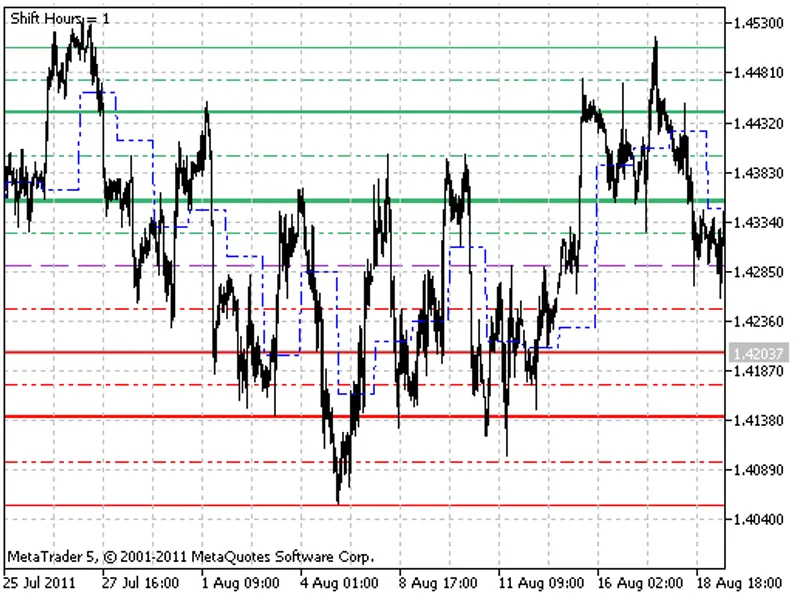
DailyPivot_Shift indicator differs from the common DailyPivot indicator, as the main levels can be calculated with day start shift. Therefore, it is possible to calculate the levels based on the local, not server time, for example, GMT-8. Also, this indicator does not consider information concerning Saturday and Sunday quotes, while generating levels on Monday.
Pivot Point (PP) is the equilibrium point - a level the price is attracted to throughout the day. Having three values for the previous day: maximum, minimum and close price, 13 levels for smaller timeframes can be calculated: equilibrium point, 6 resistance levels and 6 support levels. This levels are called check points. The check points provide the possibilty of easy determining the direction of the minor trend. Three values are most important - levels of equilibrium point, Resistance1 (RES1.0) and Support1 (SUP1.0). The pauses in the movement, or even a roll-back, are frequently seen during the moving of the price betweeen these values.
In such a way, the DailyPivot indicator:
forecasts the range of prices variation;
demonstrates the possible price stops;
demonstrates the possible points of changing the direction of price movement.
If the market on the current day opens above the equilibrium point, then it is the signal for opening long positions. If the market opens below the equilibrium point, then the current day is favourable for opening short positions.
The method of check points consists in the monitoring the possibility of turning and breakthrough when the price collides with the resistance level RES1.0 or with the support level SUP1.0. By the time when the price reaches the RES2.0, RES3.0 or SUP2.0, SUP3.0 levels, the market appears to be overbought or oversold as a rule, so these levels are mostly used as the exit levels.
This indicator was first implemented in MQL4 and published in 28.07.2006