Pivotal Points
This is a powerful addition to your MetaTrader 5 toolkit designed to optimize market analysis and performance. This technical indicator acts as a specialized analysis tool designed to visualize market data. It helps traders identify emerging trends, momentum shifts, and key support or resistance levels by plotting statistical calculations directly onto price charts.
How to Setup and Use Pivotal Points
1. Installation: Place your file in the MQL/Indicators folder via "Open Data Folder" and restart your terminal.
2. Loading: Find the indicator in the Navigator, drag it onto your chart, and configure the input parameters in the popup window.
3. Customization: Press Ctrl+I to open the indicator list, select your tool, and click "Properties" to change colors, levels, or visual styles.
4. Updating: Replace the old file in the Indicators folder with the new version and restart the platform to apply changes.
Frequently Asked Questions
Q: Why is my indicator not showing? A: Verify the file is in the MQL/Indicators folder, or try right-clicking the "Indicators" tree in the Navigator and clicking "Refresh."
Q: Do custom indicators slow down the platform? A: Too many complex indicators can impact performance; remove unused ones via the "Indicator List" (Ctrl+I).
Q: Can I use MT4 indicators on MT5? A: No, MQL4 and MQL5 are distinct languages; ensure the indicator is compiled specifically for your platform version.
Description & Settings
Pivotal points as described in the March 2009 SFO magazine article "Trading FX Like Jesse Livermore Traded Stocks" by Jamie Saettele.
Livermore's strategy was based on what he termed "pivotal points". Most traders today are aware of pivot points, and many traders use some form of pivot points (of which there are too many to count) in order to identify support and resistance, which aids in entering and exiting trades. Livermore was the first trader to refer to a pivot concept. If he was not the first, then he certainly was one of the first.
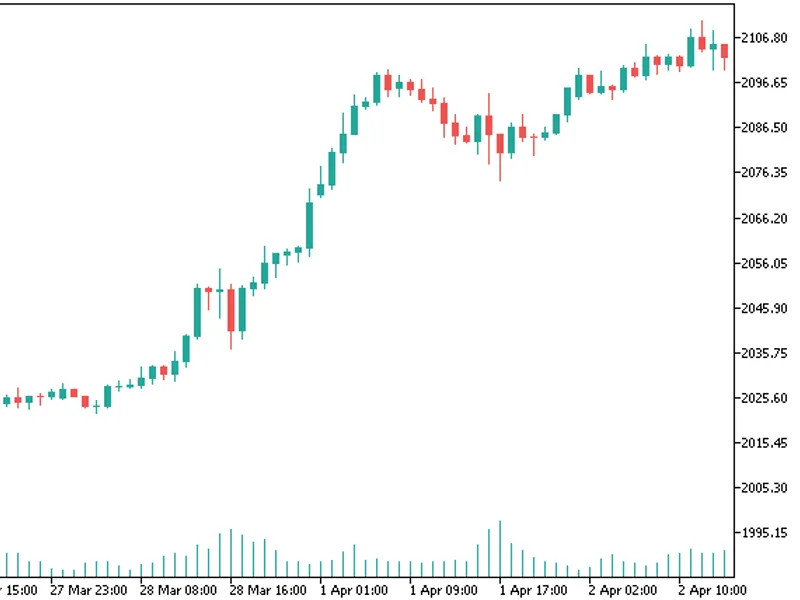
Livermore defined pivotal points as days that contained heavy volume. After a prolonged move, significantly increased volume was a key signal to him that the market was at the end of its major move. Rather than exit his position instantly, he would wait for the market to roll over and confirm that what he saw was what he referred to as a reversal pivotal point. At the end of a trend, a reversal pivotal point may be referred to today as a blow off top or a panic bottom.
However, not all pivotal points lead to reversals. Heavy volume is often present not just at the end of a major move but also toward the middle of a trend. Take a look at a stock chart to see for yourself. If, for example, heavy volume occurs and the market in question does not roll over right away (or bounce right away), then a continuation pivot point may have occurred. When a continuation pivot point occurred, Livermore added to or even initiated his position.
Since the calculation depends on ATR (Average True Range) the parameters are simple:
Look back period for maximal ATR value over nnn bars.
ATR (Average True range) period for the used ATR.