Channel at a percentage value of level breakout
This software component for MetaTrader 5 is built to enhance the capabilities of your trading environment. This technical indicator acts as a specialized analysis tool designed to visualize market data. It helps traders identify emerging trends, momentum shifts, and key support or resistance levels by plotting statistical calculations directly onto price charts.
How to Setup and Use Channel at a percentage value of level breakout
1. Installation: Place your file in the MQL/Indicators folder via "Open Data Folder" and restart your terminal.
2. Loading: Find the indicator in the Navigator, drag it onto your chart, and configure the input parameters in the popup window.
3. Customization: Press Ctrl+I to open the indicator list, select your tool, and click "Properties" to change colors, levels, or visual styles.
4. Updating: Replace the old file in the Indicators folder with the new version and restart the platform to apply changes.
Frequently Asked Questions
Q: Why is my indicator not showing? A: Verify the file is in the MQL/Indicators folder, or try right-clicking the "Indicators" tree in the Navigator and clicking "Refresh."
Q: Do custom indicators slow down the platform? A: Too many complex indicators can impact performance; remove unused ones via the "Indicator List" (Ctrl+I).
Q: Can I use MT4 indicators on MT5? A: No, MQL4 and MQL5 are distinct languages; ensure the indicator is compiled specifically for your platform version.
Description & Settings
The channel is based on one of seven price types that can be selected in input parameters. If the price has moved from the previous day's value at a distance greater than the specified value, new channel levels should be drawn. Otherwise the same channel levels will be used.
The indicator has two input parameters:
Percent
- percent to calculate the threshold distance; a new level will be drawn if this value is exceeded;
Applied price
- price used for calculating the channel.
The percentage value depends on the timeframe, on which the indicator is running. So the lower the timeframe, the lower the price movements that are considered to be significant.
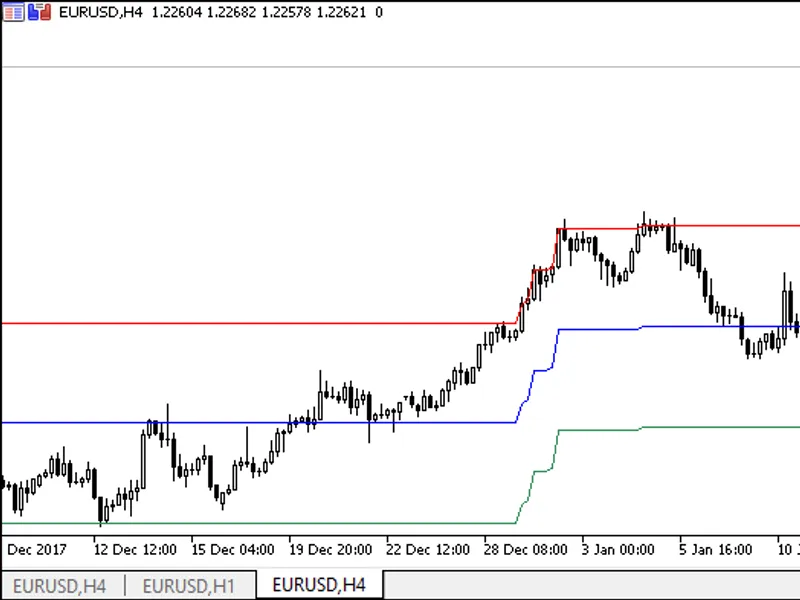
Fig.1 Percentage 100, H4
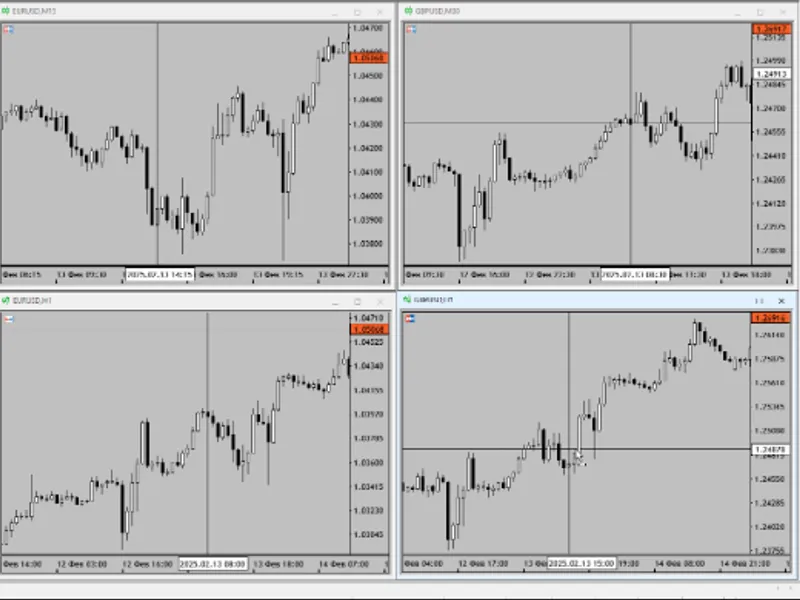
Fig.2 Percentage 50, H1
Fig.3 Percentage 10, M5