Candle Pattern Recognition Unit
This is a powerful addition to your MetaTrader 5 toolkit designed to optimize market analysis and performance. This technical indicator acts as a specialized analysis tool designed to visualize market data. It helps traders identify emerging trends, momentum shifts, and key support or resistance levels by plotting statistical calculations directly onto price charts.
How to Setup and Use Candle Pattern Recognition Unit
1. Installation: Place your file in the MQL/Indicators folder via "Open Data Folder" and restart your terminal.
2. Loading: Find the indicator in the Navigator, drag it onto your chart, and configure the input parameters in the popup window.
3. Customization: Press Ctrl+I to open the indicator list, select your tool, and click "Properties" to change colors, levels, or visual styles.
4. Updating: Replace the old file in the Indicators folder with the new version and restart the platform to apply changes.
Frequently Asked Questions
Q: Why is my indicator not showing? A: Verify the file is in the MQL/Indicators folder, or try right-clicking the "Indicators" tree in the Navigator and clicking "Refresh."
Q: Do custom indicators slow down the platform? A: Too many complex indicators can impact performance; remove unused ones via the "Indicator List" (Ctrl+I).
Q: Can I use MT4 indicators on MT5? A: No, MQL4 and MQL5 are distinct languages; ensure the indicator is compiled specifically for your platform version.
Description & Settings
Candlestick patterns, originating from Japanese rice traders in the 18th century, were designed to capture market psychology through price action (open, high, low, close). Patterns like Three Black Crows, Bullish Engulfing, or Doji reflect shifts in supply and demand, signalling reversals or continuations based on trader sentiment. These patterns were most effective in less efficient markets with lower liquidity and fewer automated systems, as they relied on human behaviour and manual trading decisions.
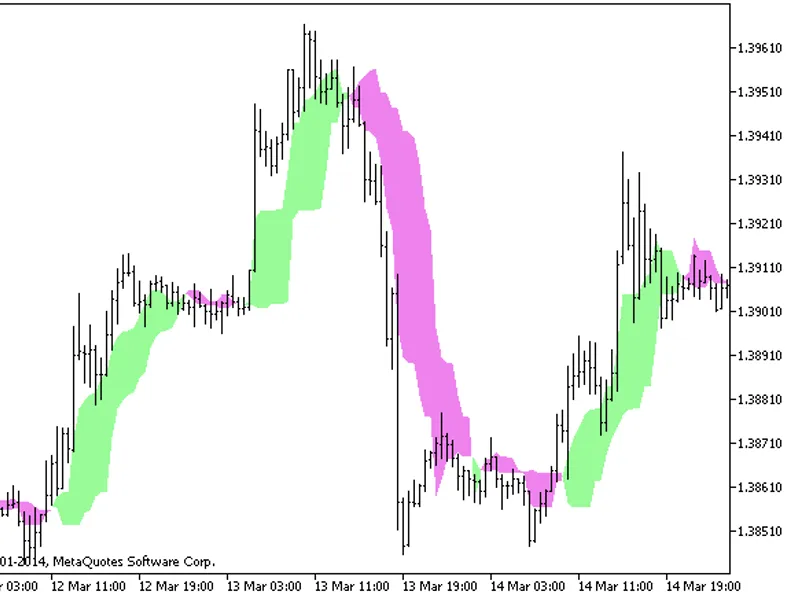
This project was a means to detect all of the well known candle pattern formations and graphically mark all bullish patterns with a green line, and all bearish patterns with a red line. MetaQuotes published some code 10+ years ago which was exclusively for expert advisors. It was a candle pattern library, and some of the logic was borrowed from this library. This library could not be used in indicators, and so, the code was completely written from scratch. This gave me the opportunity to test and redefine many of the pattern detection functions in order to achieve high quality pattern detection. Large institutions (e.g. hedge funds, market makers) use sophisticated strategies, including machine learning and quantitative models, that analyse vast datasets beyond simple price patterns. They may anticipate retail trader reactions to candlestick patterns and position against them, especially in liquid markets like forex or major indices.
Are the patterns outdated?
Not Entirely. Candlestick patterns still have value because they reflect human and algorithmic psychology embedded in price action. Retail and institutional traders alike monitor key patterns (e.g., Hammer at support levels), and self-fulfilling prophecies can occur when many traders act on the same signal.
Context Matters:
Patterns are less effective in isolation.
Their reliability increases when combined with other factors like support/resistance levels, volume, or trend indicators.
A 2019 analysis of candlestick patterns in forex found that patterns like Doji and Engulfing have statistical significance in predicting short-term reversals, but their edge diminishes in high-frequency settings due to market noise and institutional counter-strategies.
In trending markets, continuation patterns (e.g., Three White Soldiers) can be reliable, but in choppy markets, reversal patterns often fail.
Institutions don’t always outsmart patterns. Large players also use candlestick patterns as part of broader strategies, especially at key levels (e.g. Fibonacci retracements, pivot points).
In the indicator, an average is used to determine an average body size of a period of candles. The input option "use state machine" will change the indicator such that if a bullish pattern is found, it will ignore the next bullish patterns until the next bearish pattern is found, and when the next bearish pattern is found, it will ignore the next bearish patterns until the next bullish pattern is found.
There is also two different modes in the indicator: "Immediate Formation" which means that it detects the pattern without lag (but at the risk of repaint), and "Formation Confirmed" which means the pattern was confirmed in the previous bar, and there won't be any repainting.