Candle Counter
This software component for MetaTrader 5 is built to enhance the capabilities of your trading environment. This technical indicator acts as a specialized analysis tool designed to visualize market data. It helps traders identify emerging trends, momentum shifts, and key support or resistance levels by plotting statistical calculations directly onto price charts.
How to Setup and Use Candle Counter
1. Installation: Place your file in the MQL/Indicators folder via "Open Data Folder" and restart your terminal.
2. Loading: Find the indicator in the Navigator, drag it onto your chart, and configure the input parameters in the popup window.
3. Customization: Press Ctrl+I to open the indicator list, select your tool, and click "Properties" to change colors, levels, or visual styles.
4. Updating: Replace the old file in the Indicators folder with the new version and restart the platform to apply changes.
Frequently Asked Questions
Q: Why is my indicator not showing? A: Verify the file is in the MQL/Indicators folder, or try right-clicking the "Indicators" tree in the Navigator and clicking "Refresh."
Q: Do custom indicators slow down the platform? A: Too many complex indicators can impact performance; remove unused ones via the "Indicator List" (Ctrl+I).
Q: Can I use MT4 indicators on MT5? A: No, MQL4 and MQL5 are distinct languages; ensure the indicator is compiled specifically for your platform version.
Description & Settings
Key Features
Week selection
:
The SelectedWeek parameter defines which week of the month will be numbered.
If SelectedWeek = 0, all weeks are considered, and all candles will be numbered.
For non-zero values, only the candles of the specified week will be numbered.
Reverse Count
:
When NumberFirstCandle = false , numbering starts at the last candle of the day and proceeds backwards.
Dynamic Filtering
:
The indicator filters candles based on the selected week ( SelectedWeek ) and ignores the others.
Dynamic Text Positioning
:
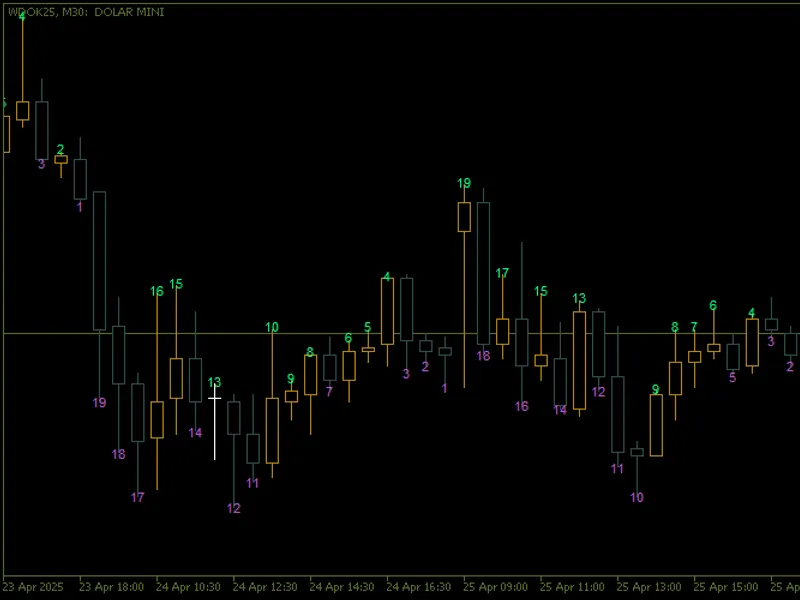
The numbers are positioned above or below the candles, depending on whether the candle is bullish or bearish.
The spacing between the text and the candle is controlled by the PriceOffsetFactor parameter.
Visual customisation
:
Colours, font, text size and anchor type can be adjusted to enhance the appearance.
Optimised Performance
:
The indicator deletes old chart objects before creating new ones, ensuring that there is no unnecessary overhead on the chart.
Input Parameters
Detailed Features
1. Filtering by Week
The GetWeekOfMonth() function calculates the week of the month for each candle.
The condition if(SelectedWeek != 0 && currentWeek != SelectedWeek) ensures that only candles from the selected week are processed.
2. Sequential counting
The count restarts whenever there is a change of day ( candleDay != previousDay ).
If NumberFirstCandle = true , the count starts on the first candle of the day.
If NumberFirstCandle = false , the count starts at the last candle of the day and continues backwards.
3. Text positioning
The text is positioned above the candle if the closing price is lower than the opening price (bearish candle).
The text is positioned below the candle if the closing price is higher than the opening price (bullish candle).
4. Creating and Updating Chart Objects
The CreateText() function creates or updates chart objects on the chart.
The objects are uniquely named using the ObjectPrefix prefix to avoid conflicts.
5. Automatic Cleaning
The DeleteObjects() function removes all graphical objects created by the indicator when it is removed or reinitialised.