

Quantora Candle Strength Analyzer MT5 - Buyer Seller Pressure and Wick Analysis
Info
The Quantora Candle Strength Analyzer MT5 - Buyer Seller Pressure and Wick Analysis is a Indicator for MetaTrader 5 that quantora candle strength analyzer mt5 is a professional price-action analysis indicator designed to evaluate the internal structure and strength of individual candles directly inside metatrader 5. Instead of looking only at whether a candle is bullish or bearish, the indicator analyzes:Candle Body % Upper Wick % Lower Wick % Buyer Pressure % Seller Pressure % Candle Direction Candle Strength Wick Rejection Range Expansion / Compression Pressure ScoreThe results are displayed in a professional dashboard that provides a quick overview of the current candle's structure and market pressure.
Usage
This tool is typically used for enhancing chart analysis and decision making.
Platform
This Indicator works exclusively on MetaTrader 5 (both build 600+ and newer versions).
Setup
Place the downloaded file in MQL5/Indicators folder via File ? Open Data Folder in MetaTrader 5.
How to Install and Use Quantora Candle Strength Analyzer MT5 - Buyer Seller Pressure and Wick Analysis
1. Installation: Place your file in the MQL/Indicators folder via "Open Data Folder" and restart your terminal.
2. Loading: Find the indicator in the Navigator, drag it onto your chart, and configure the input parameters in the popup window.
3. Customization: Press Ctrl+I to open the indicator list, select your tool, and click "Properties" to change colors, levels, or visual styles.
4. Updating: Replace the old file in the Indicators folder with the new version and restart the platform to apply changes.
Frequently Asked Questions
Q: Why is my indicator not showing? A: Verify the file is in the MQL/Indicators folder, or try right-clicking the "Indicators" tree in the Navigator and clicking "Refresh."
Q: Do custom indicators slow down the platform? A: Too many complex indicators can impact performance; remove unused ones via the "Indicator List" (Ctrl+I).
Q: Can I use MT4 indicators on MT5? A: No, MQL4 and MQL5 are distinct languages; ensure the indicator is compiled specifically for your platform version.
What this tool does
Quantora Candle Strength Analyzer MT5 is a professional price-action analysis indicator designed to evaluate the internal structure and strength of individual candles directly inside MetaTrader 5.
Typical Use Case
This Indicator excels in automated trading and technical analysis on MetaTrader 5.
Compatible Platform & Setup
This Indicator works on MetaTrader 5. Place the file in the MQL5/Indicators folder and restart the terminal.
Description & Settings
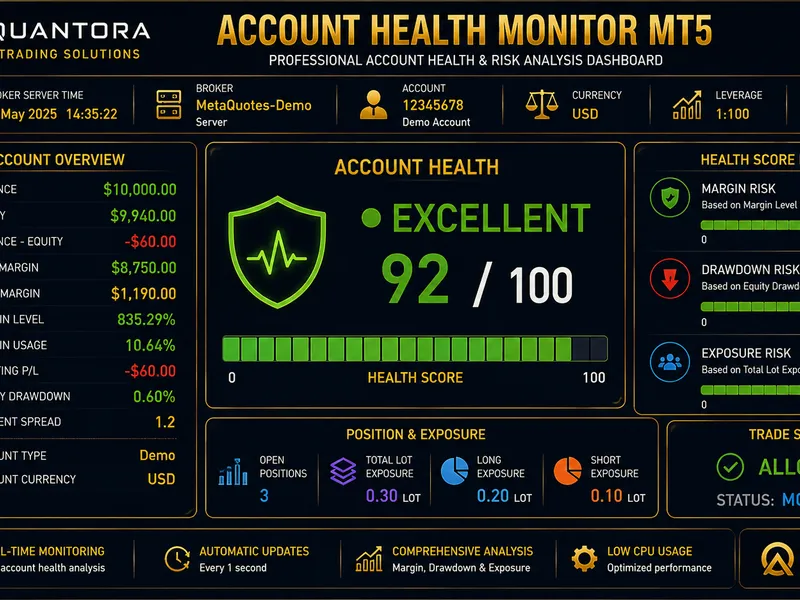
Related: Quantora Account Health Monitor MT5 - Professional Account Health and Risk Monitor - another powerful indicator for MetaTrader 5 traders.
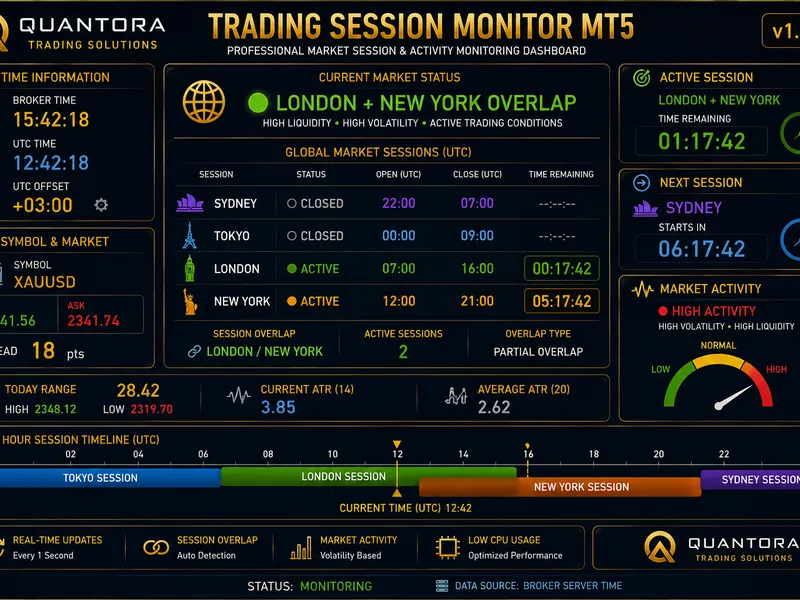
Also recommended: Quantora Trading Session Monitor MT5 - Professional Market Session and Activity Monitor - similar indicator with strong performance on MetaTrader 5.
Quantora Candle Strength Analyzer MT5
is a professional price-action analysis indicator designed to evaluate the internal structure and strength of individual candles directly inside MetaTrader 5.
Instead of looking only at whether a candle is bullish or bearish, the indicator analyzes:
Candle Body % Upper Wick % Lower Wick % Buyer Pressure % Seller Pressure % Candle Direction Candle Strength Wick Rejection Range Expansion / Compression Pressure Score
The results are displayed in a professional dashboard that provides a quick overview of the current candle's structure and market pressure.
The indicator can analyze either the
currently forming candle
or the
last closed candle
.
Main Features
Real-time candle analysis
Bullish / Bearish candle detection
Candle Body percentage
Upper Wick percentage
Lower Wick percentage
Buyer Pressure percentage
Seller Pressure percentage
Strong candle detection
Moderate candle detection
Weak / Indecision detection
Upper Wick Rejection detection
Lower Wick Rejection detection
Candle range analysis
Average range comparison
EXPANSION detection
NORMAL range detection
COMPRESSION detection
Pressure Score from
-5 to +5
Current Candle mode
Closed Candle mode
Adjustable analysis thresholds
Adjustable range lookback
Live Bid / Ask
Live Spread
Automatic dashboard updates
Professional Quantora interface
Free and open-source MQ5 code
Candle Structure Analysis
Every candle consists of three primary components:
BODY UPPER WICK LOWER WICK
The indicator calculates each component as a percentage of the candle's total High-Low range.
For example:
Total Candle Range = 35 points Body = 24 points → 68.57% Upper Wick = 6 points → 17.14% Lower Wick = 5 points → 14.29%
This allows the candle structure to be evaluated numerically rather than visually alone.
Candle Direction
The basic candle direction is determined from Open and Close.
Close > Open → BULLISH Close < Open → BEARISH Close = Open → NEUTRAL
Direction alone, however, does not determine candle strength.
The Body percentage is also evaluated.
Candle Strength
The default Strong Body threshold is:
65%
If the candle body represents at least 65% of the entire candle range, the candle can be classified as:
STRONG BULLISH or STRONG BEARISH
depending on its direction.
The default Weak Body threshold is:
30%
A candle with a body percentage at or below this level is classified as:
WEAK / INDECISION
Candles between these thresholds can be classified as:
MODERATE BULLISH or MODERATE BEARISH
All thresholds can be customized from the indicator inputs.
Buyer / Seller Pressure
The indicator includes a simple candle-based Buyer/Seller Pressure model.
Buyer Pressure is calculated according to the location of the Close inside the candle's High-Low range:
Buyer Pressure = (Close - Low) / (High - Low) × 100
Seller Pressure is:
Seller Pressure = 100 - Buyer Pressure
Example:
BUY PRESSURE: 74.30% SELL PRESSURE: 25.70%
The dashboard then classifies pressure as:
BUYERS DOMINANT SELLERS DOMINANT BALANCED
Important
Buyer/Seller Pressure is a
price-action proxy based on candle structure
.
It is
not exchange order flow, Level II data, bid/ask volume, footprint data or actual buyer/seller transaction volume
.
This distinction is important when interpreting the indicator.
Wick Rejection Analysis
The indicator separately analyzes the upper and lower candle wicks.
Default Dominant Wick threshold:
45%
If the Upper Wick represents a sufficiently large portion of the candle range and dominates the Lower Wick:
UPPER REJECTION
is displayed.
If the Lower Wick dominates:
LOWER REJECTION
is displayed.
Otherwise:
BALANCED
is displayed.
This can help identify candles where price moved significantly away from one side of its range before closing.
Range Analysis
The indicator compares the current candle range with the average range of previous candles.
Default:
Lookback = 20 candles
The calculation is:
Range Ratio = Current Candle Range / Average Range × 100
Example:
Average Range = 28.7 points Current Range = 34.5 points Range Ratio = 120.2%
Range Classification
The current version uses three range states.
EXPANSION
Range Ratio >= 150%
The current candle is significantly larger than the recent average.
NORMAL
60% < Range Ratio < 150%
The candle is within the normal recent range environment.
COMPRESSION
Range Ratio <= 60%
The current candle is significantly smaller than the recent average.
This provides additional context for interpreting candle strength.
Pressure Score
Quantora Candle Strength Analyzer combines several candle characteristics into a numerical
Pressure Score
.
Score range:
-5 → Strong Seller Pressure 0 → Balanced +5 → Strong Buyer Pressure
The model considers:
Candle Direction Candle Strength Buyer / Seller Pressure Wick Rejection
Example:
CANDLE DIRECTION: BULLISH CANDLE STRENGTH: STRONG BULLISH PRESSURE: BUYERS DOMINANT WICK: LOWER REJECTION PRESSURE SCORE: +5 / 5
A negative score represents bearish/seller-oriented candle characteristics.
A positive score represents bullish/buyer-oriented candle characteristics.
Current Candle / Closed Candle Mode
The indicator supports two analysis modes.
Current Candle
Use Current Candle = true
The currently forming candle is analyzed.
Values can change continuously until the candle closes.
Closed Candle
Use Current Candle = false
The most recently completed candle is analyzed.
This provides stable values that no longer change after candle close.
Example Dashboard
QUANTORA CANDLE STRENGTH ANALYZER MT5 ──────────────────────────────────── SYMBOL: EURUSD TIMEFRAME: M15 SPREAD: 1.5 pts CANDLE STRENGTH: STRONG BULLISH PRESSURE SCORE: +4 / 5 DIRECTION: BULLISH PRESSURE: BUYERS DOMINANT RANGE: EXPANSION CURRENT CANDLE STRUCTURE BODY: 72.60% UPPER WICK: 15.60% LOWER WICK: 11.80% BUY PRESSURE: 74.30% SELL PRESSURE: 25.70% WICK ANALYSIS: BALANCED OPEN: 1.08710 HIGH: 1.08985 LOW: 1.08640 CLOSE: 1.08920 CANDLE RANGE: 0.00345 AVG RANGE: 0.00287 RANGE vs AVG: 120.2% MODE: CURRENT CANDLE
Adjustable Parameters
Default settings:
Lookback Bars = 20 Strong Body Percent = 65 Weak Body Percent = 30 Dominant Wick Ratio = 45 Use Current Candle = true Update Interval = 2 seconds
These parameters can be customized according to the user's analysis methodology.
Supported Timeframes
The indicator operates on the timeframe of the chart where it is attached.
For example:
M1 M5 M15 M30 H1 H4 D1
Changing the chart timeframe automatically changes the candle data being analyzed.
Supported Markets
Quantora Candle Strength Analyzer can be used on broker-supported MetaTrader 5 instruments, including:
Forex
Gold and other metals
Indices
Commodities
Crypto CFDs
Other supported symbols
Because the analysis is based primarily on OHLC candle structure, it can be applied to many different markets and timeframes.
Installation
Place:
Quantora Candle Strength Analyzer MT5.mq5
inside:
MQL5 → Indicators
Open the file with MetaEditor and compile it.
Then attach
Quantora Candle Strength Analyzer MT5
to the desired MetaTrader 5 chart.
The dashboard will begin analyzing candle structure automatically.
Important Notes
The indicator is designed as a
price-action analysis and monitoring tool
.
Buyer/Seller Pressure represents the location of the candle Close within its High-Low range and should not be interpreted as actual order-flow volume.
When Current Candle mode is enabled, all values can change until the candle closes.
Strong Bullish, Strong Bearish, Buyer Dominant, Seller Dominant, Wick Rejection and Pressure Score classifications are analytical outputs based on the mathematical rules described above.
The indicator does not:
Open trades
Close trades
Modify positions
Set Stop Loss
Set Take Profit
Guarantee market direction
Provide guaranteed BUY or SELL signals
Product Information
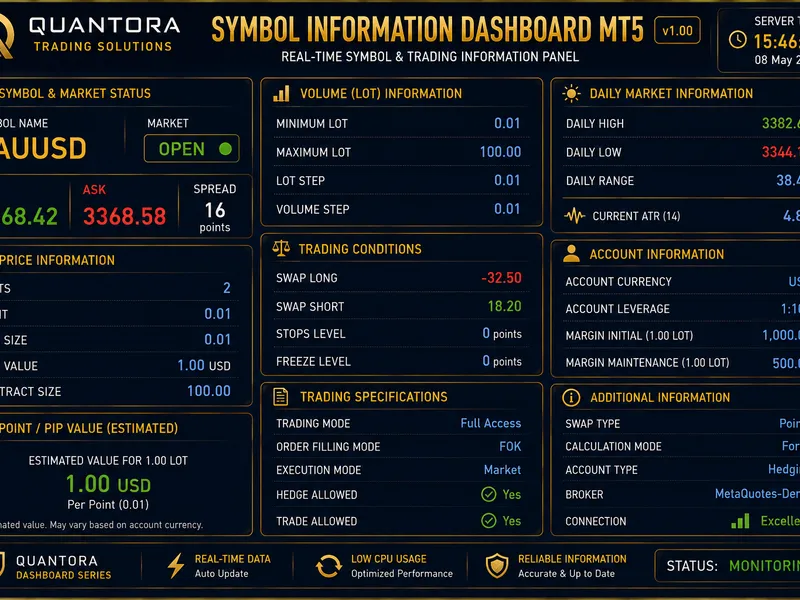
You may also like: Quantora Symbol Information Dashboard MT5 - Professional Symbol and Trading Specifications Panel - excellent alternative for indicator users on MetaTrader 5.
Source Code
#property copyright "RobotFX"
#property link "https://robotfx.org"
#property version   "1.00"
#property strict
#property indicator_chart_window
#property indicator_plots 0
#property description "This code is educational. Feel free to use, modify and upgrade as you wish. Visit ROBOTFX.ORG for professional trading tools"
input group "========== ANALYSIS SETTINGS =========="
input int    InpLookbackBars       = 20;
input double InpStrongBodyPercent  = 65.0;
.......
⚠ Limitations & Risk Warning
- This tool is provided for educational and testing purposes only.
- Past performance does not guarantee future results.
- Trading involves substantial risk of loss. Use on a demo account first.
- Results may vary depending on market conditions, broker, and settings.
- We recommend thorough backtesting and forward testing before using with real funds.