NEL O D I Trend Waves for MT5
This software component for MetaTrader 5 is built to enhance the capabilities of your trading environment. This library provides a collection of modular, reusable code. It is utilized by developers to organize common functions, allowing for the integration of complex logic across multiple Expert Advisors, indicators, or scripts without the need for code duplication.
How to Setup and Use NEL O D I Trend Waves for MT5
1. Storage: Place library files in the MQL/Libraries directory to ensure they are accessible to your projects.
2. Implementation: Include the library in your code using the #import directive, ensuring you match the exact function names and parameters.
3. Compilation: Ensure the library is present in the directory before you compile your main EA or script, as the compiler links them during this phase.
4. Management: Keep libraries organized in sub-folders if you manage many custom functions to maintain a clean project structure.
Frequently Asked Questions
Q: What is a library file used for? A: Libraries store reusable code modules, allowing you to centralize common logic used by multiple EAs or indicators.
Q: Is a library executable? A: No, libraries are non-executable files containing functions; they must be imported into an EA, indicator, or script to function.
Q: Can I update a library while the platform is running? A: You should compile your EA or script after updating a library to ensure the latest code changes are integrated.
Description & Settings
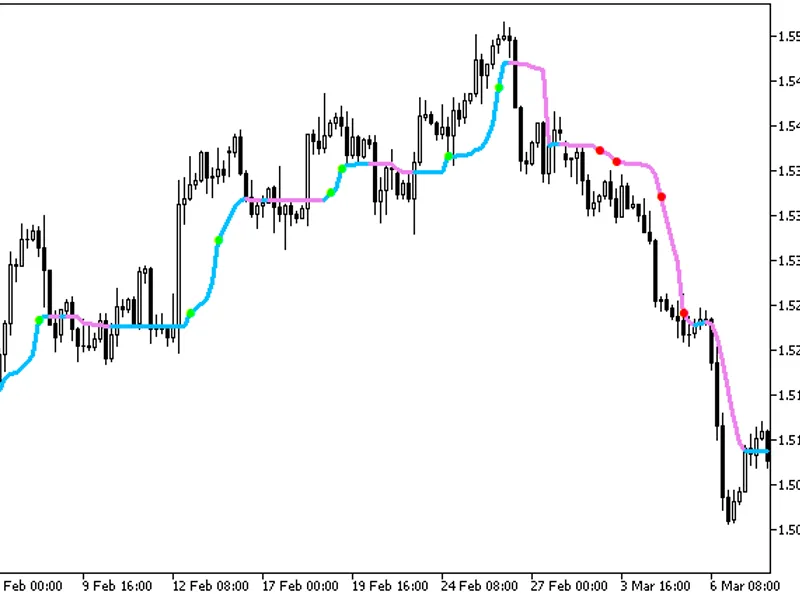
This is a highly customizable Monster Trend indicator, which calculates standard deviations, moving averages and a number of other potential support and resistance zones. By default, only the most relevant lines will be drawn, but you can customize what you want to see through input parameters. If everything is turned on, the indicator plots 119 lines in changing color, so ... don't be surprised if you can't see anything when you do that ;)
NOTE: Because this indicator performs A LOT of calculations on a number of different time periods, it can be very expensive in terms of CPU usage, so ... use with care. To reduce the delay when adding the indicator to a chart and switching time-frames, it will only be calculating data for a limited number of bars in the history (see input parameter "History Range").