BB Squeeze Dark Indicator
This professional-grade solution for MetaTrader 4 helps traders achieve greater efficiency in their daily workflow. This technical indicator acts as a specialized analysis tool designed to visualize market data. It helps traders identify emerging trends, momentum shifts, and key support or resistance levels by plotting statistical calculations directly onto price charts.
How to Setup and Use BB Squeeze Dark Indicator
1. Installation: Place your file in the MQL/Indicators folder via "Open Data Folder" and restart your terminal.
2. Loading: Find the indicator in the Navigator, drag it onto your chart, and configure the input parameters in the popup window.
3. Customization: Press Ctrl+I to open the indicator list, select your tool, and click "Properties" to change colors, levels, or visual styles.
4. Updating: Replace the old file in the Indicators folder with the new version and restart the platform to apply changes.
Frequently Asked Questions
Q: Why is my indicator not showing? A: Verify the file is in the MQL/Indicators folder, or try right-clicking the "Indicators" tree in the Navigator and clicking "Refresh."
Q: Do custom indicators slow down the platform? A: Too many complex indicators can impact performance; remove unused ones via the "Indicator List" (Ctrl+I).
Q: Can I use MT4 indicators on MT5? A: No, MQL4 and MQL5 are distinct languages; ensure the indicator is compiled specifically for your platform version.
Description & Settings
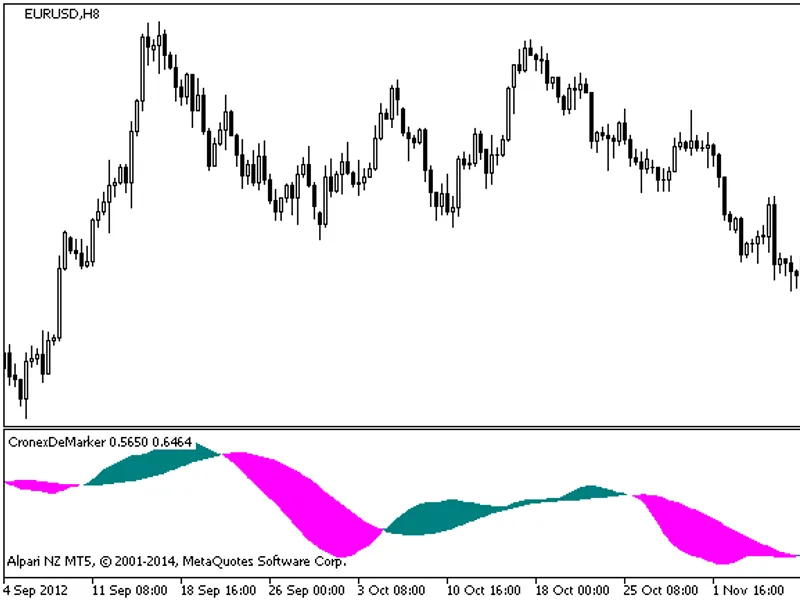
The indicator starts below the main chart window and is very simple to use.
There are 2 steps to take signals via this indicator.
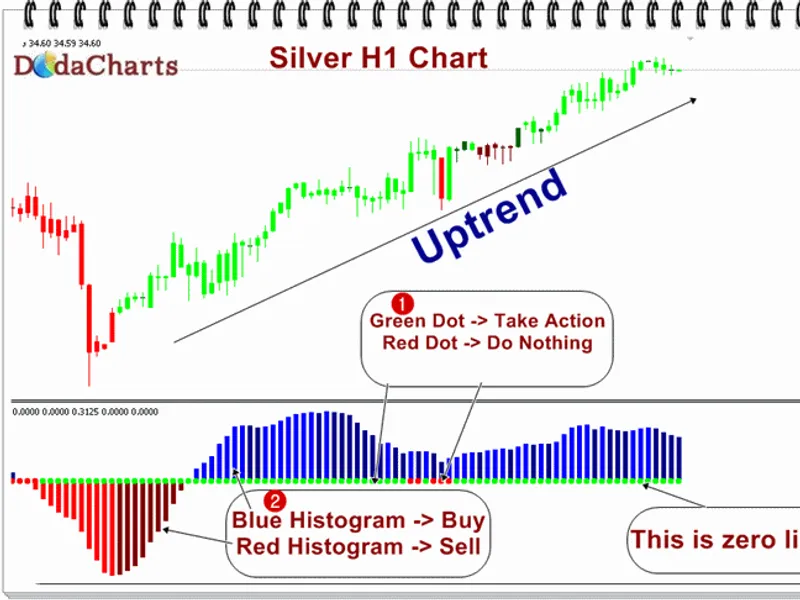
Step 1:
See the zero line. It consists of either Red dot or Green dot. If it is Green dot, it’s time to take action. Now, action (buy or sell) has been defined in step 2 below. If it’s Red dot, do nothing and stay away. Just hold your position.
Step 2:
If you see Green dot in zero line, it’s time to either Buy or Sell. For that, see the histogram lines, which are either on above zero line (blue lines) or below zero lines (red lines). Just buy on blue histogram and sell on red histogram.
In a summary, take long position when you see green dot on zero line AND blue histogram lines.
And sell your position, when you see green dot on zero line AND red histogram lines.
Recommendations:
I’ve tested it on different currency pairs and time frame. It works on everywhere but gives best results on high time frame like H4. It’s always better to trade on H4 time frame to avoid volatility of the market and false signals.
You can check more examples of this indicator on my website.