


Bollinger Bands ®
Info
The Bollinger Bands ® is a Indicator for MetaTrader 5 that bollinger bands ® technical indicator (bb) is similar to envelopes. The only difference is that the bands of Envelopes are plotted a fixed distance (%) away from the moving average, while the Bollinger Bands are plotted a certain number of standard deviations away from it.
Usage
This tool is typically used for enhancing chart analysis and decision making.
Platform
This Indicator works exclusively on MetaTrader 5 (both build 600+ and newer versions).
Setup
Place the downloaded file in MQL5/Indicators folder via File ? Open Data Folder in MetaTrader 5.
How to Install and Use Bollinger Bands ®
1. Installation: Place your file in the MQL/Indicators folder via "Open Data Folder" and restart your terminal.
2. Loading: Find the indicator in the Navigator, drag it onto your chart, and configure the input parameters in the popup window.
3. Customization: Press Ctrl+I to open the indicator list, select your tool, and click "Properties" to change colors, levels, or visual styles.
4. Updating: Replace the old file in the Indicators folder with the new version and restart the platform to apply changes.
Frequently Asked Questions
Q: Why is my indicator not showing? A: Verify the file is in the MQL/Indicators folder, or try right-clicking the "Indicators" tree in the Navigator and clicking "Refresh."
Q: Do custom indicators slow down the platform? A: Too many complex indicators can impact performance; remove unused ones via the "Indicator List" (Ctrl+I).
Q: Can I use MT4 indicators on MT5? A: No, MQL4 and MQL5 are distinct languages; ensure the indicator is compiled specifically for your platform version.
What this tool does
Bollinger Bands ® technical indicator (BB) is similar to Envelopes.
Typical Use Case
This Indicator excels in automated trading and technical analysis on MetaTrader 5.
Compatible Platform & Setup
This Indicator works on MetaTrader 5. Place the file in the MQL5/Indicators folder and restart the terminal.
Description & Settings
Related: AD X Wilder with Bollinger Bands - another powerful indicator for MetaTrader 5 traders.
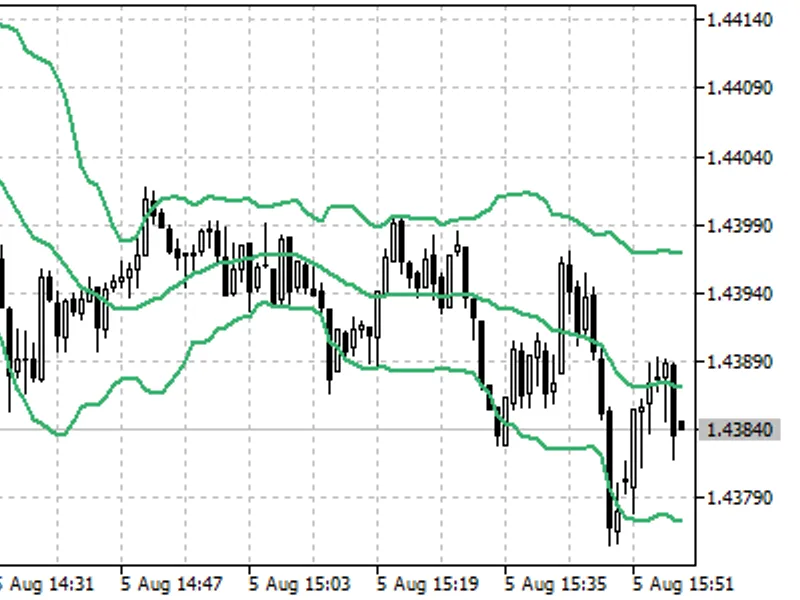
Bollinger Bands ® technical indicator (BB) is similar to Envelopes. The only difference is that the bands of Envelopes are plotted a fixed distance (%) away from the moving average, while the Bollinger Bands are plotted a certain number of standard deviations away from it. Standard deviation is a measure of volatility, therefore Bollinger Bands adjust themselves to the market conditions. When the markets become more volatile, the bands widen and they contract during less volatile periods.
Also recommended: Bollinger Bandwidth 1. 0 for Meta Trader 5 - similar indicator with strong performance on MetaTrader 5.
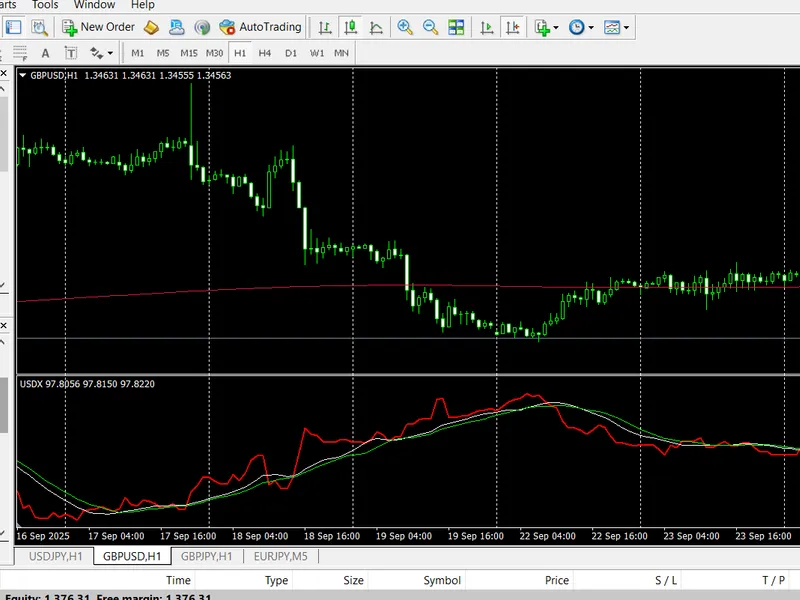
Bollinger Bands are usually plotted on the price chart, but they can be also added to the indicator chart. Just like in case of the Envelopes, the interpretation of the Bollinger Bands is based on the fact that the prices tend to remain in between the top and the bottom line of the bands. A distinctive feature of the Bollinger Band indicator is its variable width due to the volatility of prices. In periods of considerable price changes (i.e. of high volatility) the bands widen leaving a lot of room to the prices to move in. During standstill periods, or the periods of low volatility the band contracts keeping the prices within their limits.The following traits are particular to the Bollinger Band:
abrupt changes in prices tend to happen after the band has contracted due to decrease of volatility;
if prices break through the upper band, a continuation of the current trend is to be expected;
if the pikes and hollows outside the band are followed by pikes and hollows inside the band, a reverse of trend may occur;
the price movement that has started from one of the band’s lines usually reaches the opposite one.
The last observation is useful for forecasting price guideposts.
Bollinger Band indicator
Calculation:
Bollinger bands are formed by three lines. The middle line (ML) is a usual Moving Average.
ML = SUM (CLOSE, N) / N = SMA (CLOSE, N)
The top line (TL) is the same as the middle line a certain number of standard deviations (D).
TL = ML + (D * StdDev)
The bottom line (BL) is the middle line shifted down by the same number of standard deviations.
BL = ML - (D * StdDev)
where:
SUM (..., N) - sum over N periods;
CLOSE - close price;
N - number of periods used in calculation;
SMA - Simple Moving Average;
SQRT - square root;
StdDev - standard deviation:
StdDev = SQRT (SUM ((CLOSE — SMA (CLOSE, N))^2, N)/N)
It is recommended to use 20-period Simple Moving Average as the middle line, and plot top and bottom lines two standard deviations away from it. Besides, moving averages of less than 10 periods are of little effect.
You may also like: Adaptive Moving Average with Bollinger Bands ® - excellent alternative for indicator users on MetaTrader 5.
⚠ Limitations & Risk Warning
- This tool is provided for educational and testing purposes only.
- Past performance does not guarantee future results.
- Trading involves substantial risk of loss. Use on a demo account first.
- Results may vary depending on market conditions, broker, and settings.
- We recommend thorough backtesting and forward testing before using with real funds.