AD X Wilder with Bollinger Bands
This software component for MetaTrader 5 is built to enhance the capabilities of your trading environment. This technical indicator acts as a specialized analysis tool designed to visualize market data. It helps traders identify emerging trends, momentum shifts, and key support or resistance levels by plotting statistical calculations directly onto price charts.
How to Setup and Use AD X Wilder with Bollinger Bands
1. Installation: Place your file in the MQL/Indicators folder via "Open Data Folder" and restart your terminal.
2. Loading: Find the indicator in the Navigator, drag it onto your chart, and configure the input parameters in the popup window.
3. Customization: Press Ctrl+I to open the indicator list, select your tool, and click "Properties" to change colors, levels, or visual styles.
4. Updating: Replace the old file in the Indicators folder with the new version and restart the platform to apply changes.
Frequently Asked Questions
Q: Why is my indicator not showing? A: Verify the file is in the MQL/Indicators folder, or try right-clicking the "Indicators" tree in the Navigator and clicking "Refresh."
Q: Do custom indicators slow down the platform? A: Too many complex indicators can impact performance; remove unused ones via the "Indicator List" (Ctrl+I).
Q: Can I use MT4 indicators on MT5? A: No, MQL4 and MQL5 are distinct languages; ensure the indicator is compiled specifically for your platform version.
Description & Settings
Description:
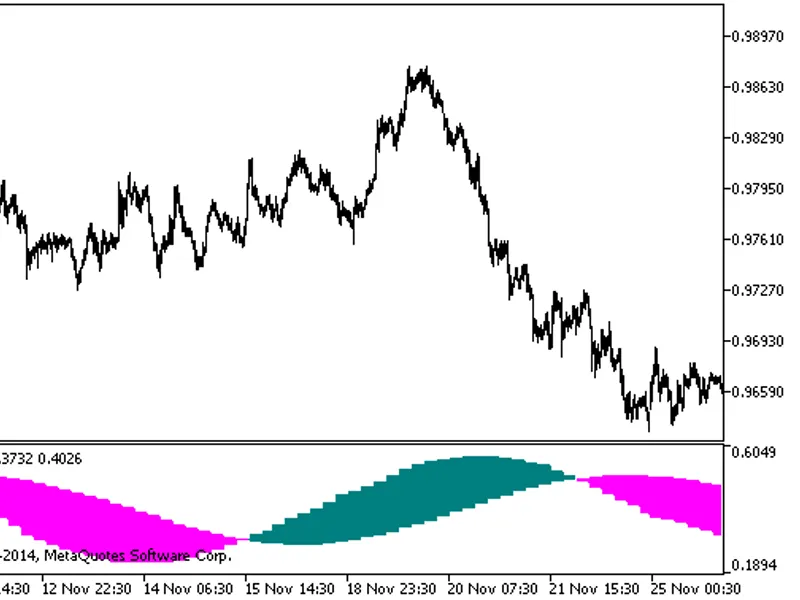
This custom indicator combines the ADX Wilder indicator with Bollinger Bands to visualize trend strength and volatility in a single subwindow.
The indicator calculates the standard ADX Wilder, including +DI and −DI, and then applies Bollinger Bands to the ADX line. This allows traders to identify when trend strength is expanding or contracting relative to its recent volatility.
When the ADX line approaches or breaks the upper Bollinger Band, it may indicate unusually strong trend momentum. When it moves toward the lower band, it may signal weakening trend strength or a ranging market.
This tool helps traders detect increasing trend strength, trend exhaustion or weakening momentum, and volatility expansion in trend strength.
Indicator components include the ADX line, +DI and −DI directional movement lines, and Bollinger Bands applied to the ADX line.
Input parameters allow users to adjust the ADX period, Bollinger period, and Bollinger deviation to match their trading strategy.
This indicator can be used together with price action or other technical indicators for additional confirmation.
Image:
Recommendations:
Use ADX above the middle band to confirm strengthening trends.
ADX crossing above the upper band may indicate strong momentum continuation.
ADX falling below the middle band may signal weakening trend strength.
The indicator can be used on all timeframes and across multiple markets including Forex, Stocks, Indices, Commodities, and Crypto.