Extended Regression Stop And Reverse
This tool for MetaTrader 4 is specifically engineered to streamline your trading operations. This technical indicator acts as a specialized analysis tool designed to visualize market data. It helps traders identify emerging trends, momentum shifts, and key support or resistance levels by plotting statistical calculations directly onto price charts.
How to Setup and Use Extended Regression Stop And Reverse
1. Installation: Place your file in the MQL/Indicators folder via "Open Data Folder" and restart your terminal.
2. Loading: Find the indicator in the Navigator, drag it onto your chart, and configure the input parameters in the popup window.
3. Customization: Press Ctrl+I to open the indicator list, select your tool, and click "Properties" to change colors, levels, or visual styles.
4. Updating: Replace the old file in the Indicators folder with the new version and restart the platform to apply changes.
Frequently Asked Questions
Q: Why is my indicator not showing? A: Verify the file is in the MQL/Indicators folder, or try right-clicking the "Indicators" tree in the Navigator and clicking "Refresh."
Q: Do custom indicators slow down the platform? A: Too many complex indicators can impact performance; remove unused ones via the "Indicator List" (Ctrl+I).
Q: Can I use MT4 indicators on MT5? A: No, MQL4 and MQL5 are distinct languages; ensure the indicator is compiled specifically for your platform version.
Description & Settings
The Extended Regression StopAndReverse indicator is based on some popular and rather useful programs, scripts and experts.
Extended Regression StopAndReverse
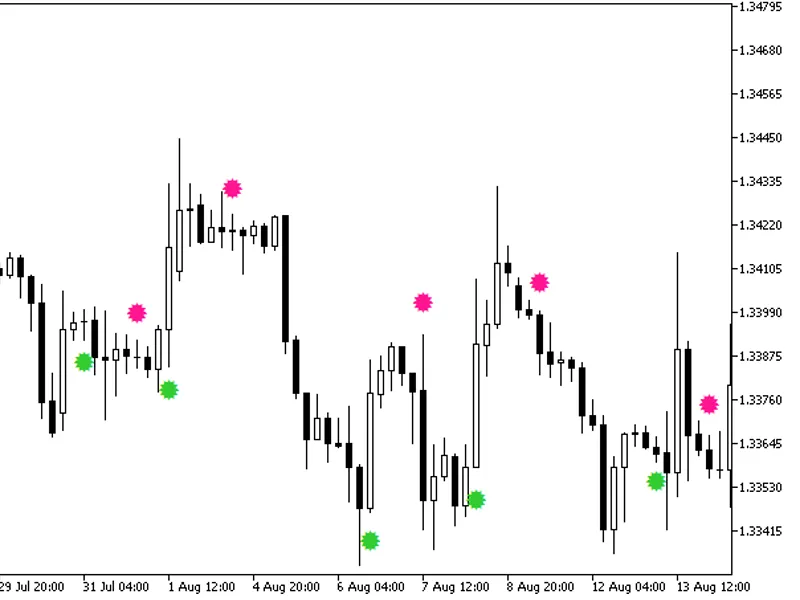
At startup the indicator automatically determines the timeframe, calculates two types of regression on the current timeframe and calculates the root-mean-square deviation of the price on the current range. First of all, the straight golden line - the first degree regression line which shows the direction and the state of the current true trend on the selected timeframe. It is clear that the greater the angle to the horizontal, the stringer the trend. Thus, it is possible to make certain conclusions regarding the status of the currency pair by the current position of the price relative to the regression line. For example, in the most general case, if the ray is upwards and the price is below the ray, that means a small retracement had ended recently, and it should be expected that the price naturally moves to the area above the regression ray within the continuation of the trend. The support and resistance lines are located parallel to the trend at some distance from the golden line. They are, respectively, above and below the trend line. These are valid linear thresholds, as they are plotted based on the value of the root-mean-square deviation on the calculated range with the corresponding Fibonacci coefficient. Using the value of the root-mean-square deviation and the corresponding Fibonacci coefficients, the indicator calculates the values of the adaptive "stop" and "stop/reversal" levels for the current price with the help of a special algorithm. These levels can be interpreted as instantaneous limit values of the deviation on the time interval of the last bar. These values are displayed by colored dots above and/or below the price according to the state of the currency pair. The dots shaded blue are drawn below the price, the brighter ones are "stop", the darker ones - "stop/reversal". The dots shaded red are drawn above the price, and also display the stop and reversal levels. For any value of the price at any bar the indicator always displays only two instantaneous value levels, but not all four. This helps to make the corresponding conclusions about the state of the trend. Important note - in case of a true breakout of one or both stop levels, when the close price of the bar exceeds the corresponding level, the indicator displays this event by reversing the instantaneous values. For example, if those were resistance levels before a breakout, then the indicator draws instantaneous support levels instead of them. Thus, if there is a reverse - it is at least a short-term change of the trend by a small retracement The indicator uses the specified regression coefficient to calculate and display the non-linear channel, that is necessary for predicting the nearest future, and which also serves as the linear channel, i.e. to display the valid support and resistance levels, but which change dynamically and non-linearly over time. By default the indicator uses a coefficient of parabolic regression, i.e. 2.
The interpretation of the indicator values is relatively simple:
- For example, let the non-linear regression channel bend and cross the golden line of an uptrend from above. This is an exhaustion signal - a retracement or even a trend change is expected. If it crosses it from below - this is a signal of an increase in the trend strength. Respectively, everything is mirrored during a downtrend. It is also necessary to switch to a higher and smaller timeframes and to look at the situation there.
The price crossing the support or resistance lines:
- If the price leaps beyond the resistance during an uptrend, it is expected to return to the channel, but it is not necessary to close orders. If the price jumps beyond the support during an uptrend, a strong retracement is to be expected if it breaks out both stop/reversal levels. For a more accurate understanding of the situation it is also necessary to consider the state of the channel relative to the golden line of the trend and the values on the adjacent timeframes. Respectively, everything is mirrored during a downtrend. All channels are dynamically recalculated and redrawn with each new bar depending on the current market situation. Despite the rather complex math, the indicator does not load the CPU at all and does not require any special computer resources.
Input parameters:
_RegressionDegree – degree of the non-linear regression; reasonable values – 2 or 3. _K_DeviationChannel – deviation multiplier (not the Fibonacci coefficient!); allows to specify the multiplier for the deviation, reasonable value - 2, but someone might benefit from the value 3.