Auto Trend Lines Indicator for MQ L5
This software component for MetaTrader 5 is built to enhance the capabilities of your trading environment. This technical indicator acts as a specialized analysis tool designed to visualize market data. It helps traders identify emerging trends, momentum shifts, and key support or resistance levels by plotting statistical calculations directly onto price charts.
How to Setup and Use Auto Trend Lines Indicator for MQ L5
1. Installation: Place your file in the MQL/Indicators folder via "Open Data Folder" and restart your terminal.
2. Loading: Find the indicator in the Navigator, drag it onto your chart, and configure the input parameters in the popup window.
3. Customization: Press Ctrl+I to open the indicator list, select your tool, and click "Properties" to change colors, levels, or visual styles.
4. Updating: Replace the old file in the Indicators folder with the new version and restart the platform to apply changes.
Frequently Asked Questions
Q: Why is my indicator not showing? A: Verify the file is in the MQL/Indicators folder, or try right-clicking the "Indicators" tree in the Navigator and clicking "Refresh."
Q: Do custom indicators slow down the platform? A: Too many complex indicators can impact performance; remove unused ones via the "Indicator List" (Ctrl+I).
Q: Can I use MT4 indicators on MT5? A: No, MQL4 and MQL5 are distinct languages; ensure the indicator is compiled specifically for your platform version.
Description & Settings
Dual Detection Mode:
Mode A: Dual Pivot Detection - identifies trendlines through 2 pivot points
Mode B: Adaptive Slope Analysis - adaptive slope-based analysis
Breakout Detection System:
Automatic support/resistance breakout detection
Real-time alerts on breakouts
Arrow markers at breakout points
Customizable breakout threshold (pips)
Auto-Adjust Feature:
Automatically adjusts trendlines after breakouts
Stores historical trendline data
Displays up to 3 historical trendlines
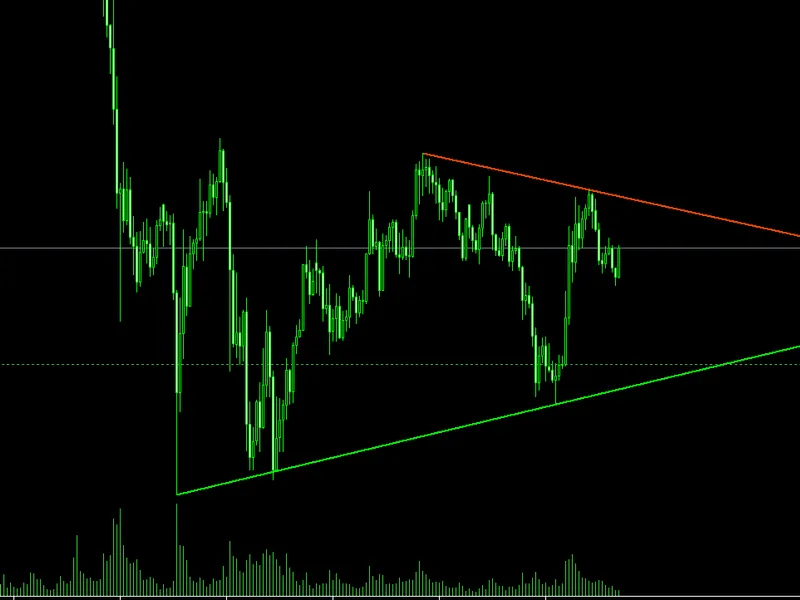
Smart Visualization:
Customizable colors, thickness, and line styles
Clear distinction between support (lime) and resistance (orange-red)
Dimmed historical lines for better tracking
Flexible Configuration:
15+ customizable parameters
Adjustable lookback periods and edge offsets
Independent feature toggles
Application:
Ideal for swing/intraday traders, supports accurate trend detection and entry point identification.