Attention Level
This professional-grade solution for MetaTrader 5 helps traders achieve greater efficiency in their daily workflow. This technical indicator acts as a specialized analysis tool designed to visualize market data. It helps traders identify emerging trends, momentum shifts, and key support or resistance levels by plotting statistical calculations directly onto price charts.
How to Setup and Use Attention Level
1. Installation: Place your file in the MQL/Indicators folder via "Open Data Folder" and restart your terminal.
2. Loading: Find the indicator in the Navigator, drag it onto your chart, and configure the input parameters in the popup window.
3. Customization: Press Ctrl+I to open the indicator list, select your tool, and click "Properties" to change colors, levels, or visual styles.
4. Updating: Replace the old file in the Indicators folder with the new version and restart the platform to apply changes.
Frequently Asked Questions
Q: Why is my indicator not showing? A: Verify the file is in the MQL/Indicators folder, or try right-clicking the "Indicators" tree in the Navigator and clicking "Refresh."
Q: Do custom indicators slow down the platform? A: Too many complex indicators can impact performance; remove unused ones via the "Indicator List" (Ctrl+I).
Q: Can I use MT4 indicators on MT5? A: No, MQL4 and MQL5 are distinct languages; ensure the indicator is compiled specifically for your platform version.
Description & Settings
As an intraday trader with two years of experience, I know how important it is to accurately predict price movement within a day. Incorrect prediction of intraday price direction may produce very sad results, even when using a good money or risk management system. And what if you had several such days in a row? This may become a psychological issue putting high pressure on a trader. During the development of my trading system I had to invent methods to overcome such problem. And here I want to share my most interesting idea.
I present you a simple indicator which places a horizontal level on a chart. I would call it an attention level. So, what is this level and how it is calculated? It's all very simple — I take a 10-day value of the ATR indicator, on a daily interval, of course, and if the previous day of the symbol I trade was growing, I subtract this ATR value from its maximum price. If the day was falling, then I add the ATR value to its minimum price. Then I draw a horizontal level through one of these values.
If I trade by an uptrend, and the price falls below the attention level, I stop all trade operations, because it's obvious that the market situation has changed and doesn't match the original trade plan. I don't have to lose money buying on a probably reversed trend or during its correction period.
This simple idea has saved me a lot of money on stop orders which would trigger if I didn't use this indicator.
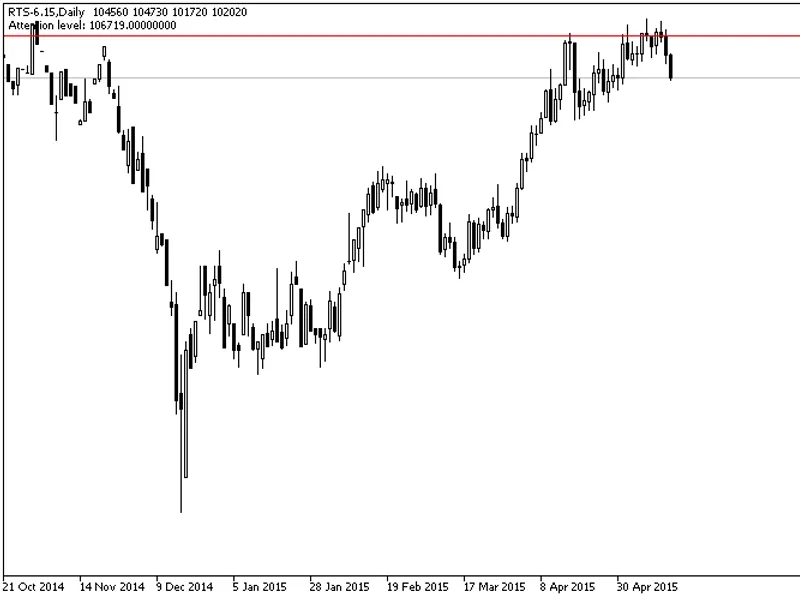
Fig.1. Daily chart of the RTS index futures contract and the attention level
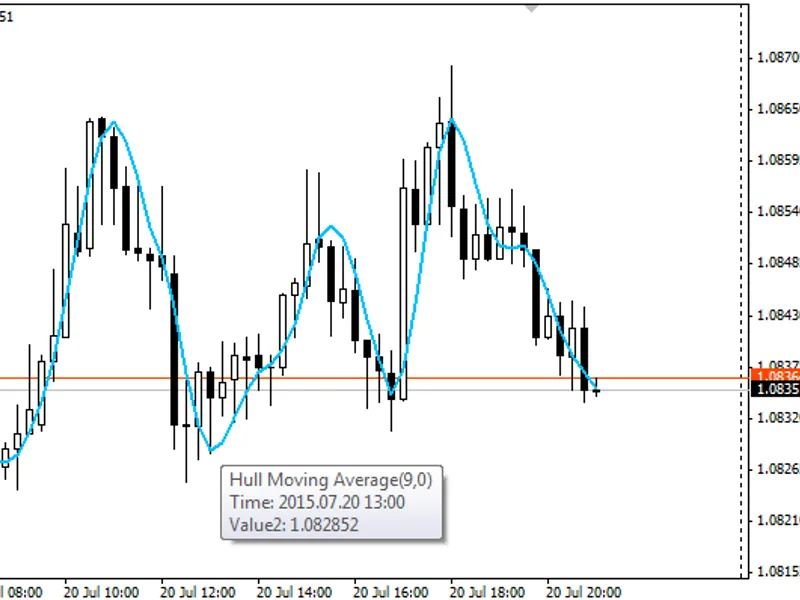
Fig.2. H1 chart of the RTS index futures contract and the attention level
The code itself is very simple, I used the CList and CObjectHLine classes from the Standard Library to quickly create and manage graphical objects.
Tips:
If you predicted an uptrend, and the price has passed the attention level in the reverse direction, you should stop trading and revise your trade plan, and also refrain from further buying.
If you predicted a downtrend, and the price has passed the attention level in the reverse direction, you should stop trading and revise your trading plan, and also refrain from further selling.
Indicator settings:
ATR_maPeriod
— averaging period of ATR indicator (by default, 10 days).
LevelColor
— level line color (by default, red).
LevelStyle
— level line style (by default, solid).
LevelWidth —
level line thickness (by default, 1).