Download ALL MT5 indicators (5742)

Similar MetaTrader Tools








AT&CF Indicator
Info
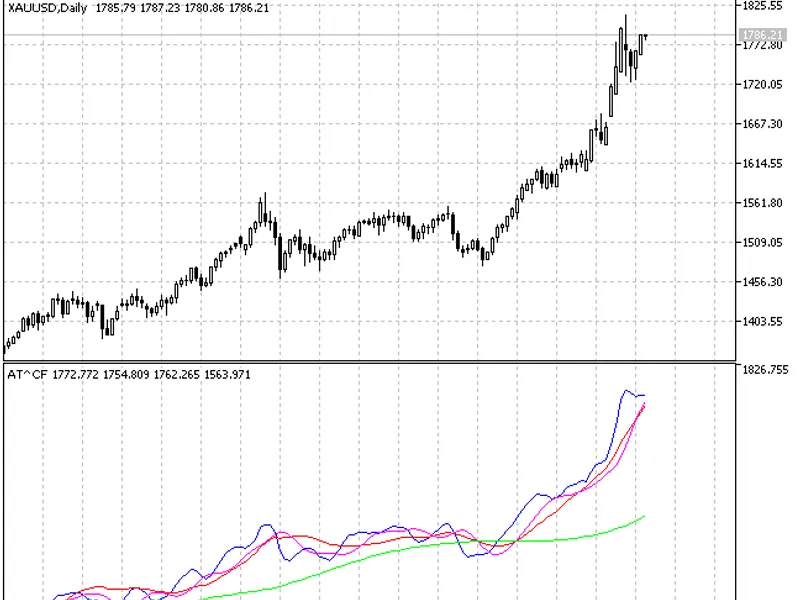
The AT&CF Indicator is a Indicator for MetaTrader 5 that this indicator presents all four digital filters that form the basis of the at&cf method in one separate window. AT&CF MethodThe main objective of the AT&CF method is creation of the minimum number of technical tools possessing set properties.
Usage
This tool is typically used for enhancing chart analysis and decision making.
Platform
This Indicator works exclusively on MetaTrader 5 (both build 600+ and newer versions).
Setup
Place the downloaded file in MQL5/Indicators folder via File ? Open Data Folder in MetaTrader 5.
How to Install and Use AT&CF Indicator
1. Installation: Place your file in the MQL/Indicators folder via "Open Data Folder" and restart your terminal.
2. Loading: Find the indicator in the Navigator, drag it onto your chart, and configure the input parameters in the popup window.
3. Customization: Press Ctrl+I to open the indicator list, select your tool, and click "Properties" to change colors, levels, or visual styles.
4. Updating: Replace the old file in the Indicators folder with the new version and restart the platform to apply changes.
Frequently Asked Questions
Q: Why is my indicator not showing? A: Verify the file is in the MQL/Indicators folder, or try right-clicking the "Indicators" tree in the Navigator and clicking "Refresh."
Q: Do custom indicators slow down the platform? A: Too many complex indicators can impact performance; remove unused ones via the "Indicator List" (Ctrl+I).
Q: Can I use MT4 indicators on MT5? A: No, MQL4 and MQL5 are distinct languages; ensure the indicator is compiled specifically for your platform version.
What this tool does
This indicator presents all four digital filters that form the basis of the AT&CF method in one separate window.
Typical Use Case
This Indicator excels in automated trading and technical analysis on MetaTrader 5.
Compatible Platform & Setup
This Indicator works on MetaTrader 5. Place the file in the MQL5/Indicators folder and restart the terminal.
Description & Settings
Related: Previous Day High, Low, and Close Indicator - another powerful indicator for MetaTrader 5 traders.
This indicator presents all four digital filters that form the basis of the AT&CF method in one separate window.Also recommended: Quantora ADR Calculator MT5 - Professional Average Daily Range Indicator for MetaTrader 5 - similar indicator with strong performance on MetaTrader 5.
AT&CF Method
The main objective of the AT&CF method is creation of the minimum number of technical tools possessing set properties. There must be enough of these tools to build a trading algorithm that would provide maximum possible profitability, while possessing the least possible risk level, for some definite market.
Basic Rules of Interpretation
- Rising SATL line indicates the bullish market trend. SATL local minimum point is a point of the beginning of the bearish trend reverse. The point, at which STLM changed from negative to positive, indicates the end of the bearish trend reverse.
- Falling SATL line indicates the bearish market trend. SATL local maximum point is a point of the beginning of the bullish trend reverse. The point, at which STLM changed from positive to negative, indicates the end of the bullish trend reverse.
- SATL form that is close to the horizontal one indicates the neutral position.
STLM Interpretation
STLM interpretation requires special attention. Positive STLM value indicates the bullish trend and negative one indicates the bearish trend. STLM is a leading indicator. STLM local minimum always goes before SATL local minimum. STLM local maximum always goes before SATL local maximum.
- Reaching of its extreme points by STLM is necessary but not sufficient condition of SATL curve reaching a top or a bottom.
- Rising STLM in case of the rising SATL indicates bullish trend acceleration.
- Horizontal and positive STLM in case of the rising SATL indicates steady bullish trend. The more is the STLM absolute value, the stronger is the bullish trend.
- Falling STLM in case of the falling SATL indicates bearish trend acceleration.
- Horizontal and negative STLM in case of the rising SATL indicates steady bearish trend. The more is the STLM absolute value, the stronger is the bearish trend.
FATL Trend Line
- Rising "fast" FATL trend line in case of the rising "slow" SATL trend line indicates a strong bullish market trend.
- Falling "fast" FATL line in case of the falling "slow" SATL line indicates a strong bearish market trend.
- Rising FATL line in case of the SATL falling line indicates either bullish correction during a bearish trend, or consolidation.
- Falling FATL line in case of the rising SATL line indicates either bearish correction during a bullish trend, or consolidation.
- In case FATL and SATL lines start or resume moving in one direction, it indicates either a trend reverse, or end of correction and continuation of the price movement towards SATL.
You may also like: Session High-Low Indicator for MetaTrader - excellent alternative for indicator users on MetaTrader 5.
Source Code
/*
 * for the indicator to work, place the
 * smoothalgorithms.mqh version >= 3.01!!!
 * in the directory: metatrader\\mql5\include
 */
#property copyright "robotfx"
#property link "https://robotfx.org"
#property version   "1.00"
#property indicator_separate_window
#property indicator_buffers 4
.......
⚠ Limitations & Risk Warning
- This tool is provided for educational and testing purposes only.
- Past performance does not guarantee future results.
- Trading involves substantial risk of loss. Use on a demo account first.
- Results may vary depending on market conditions, broker, and settings.
- We recommend thorough backtesting and forward testing before using with real funds.